FAQs & media library

Good to know!

FAQ

The most important questions and answers at a glance.

Documentation & Data sheets

If you need more detailed information, please contact your KBR representative directly or use the contact form.
Please note that if you have any questions, we will need the exact product name in order to assist you as best as possible.
You can find the standard documentation and technical data in the following locations:

We have provided the current system requirements and communication schema for visual energy here.

The communication scheme shows all the ports used. Both communication between the bus master and visual energy Web and between the client and Web can be set up securely.

The comprehensive documentation for the visual energy energy data management system is part of our 5-star service. You can find it directly in visual energy in the top-right corner of the menu by clicking the icon with the three dots.

To determine the current consumption, supply cable, and fuse rating for a reactive power compensation system, you can use our handy red KBR data slider (feel free to ask your KBR contact person about it).
Alternatively, you can use our digital solution and calculate the values using the additional calculation feature in the tool for designing reactive power compensation systems.

Ordering & Delivery

You can find the estimated delivery time in your quote.
Since we rely on in-house production and short delivery routes, our manufacturing process is efficient, and you’ll receive your order as quickly as possible.

If you need a specific delivery date, please let us know in advance.

For measurements or service calls, our service team will contact you directly to schedule an appointment.

We specialize in customized solutions. Every company’s energy infrastructure is different and requires a tailored approach. If you have specific requirements, please feel free to contact your KBR representative. Together, we’ll find the right solution for you.

visual energy - energy data

At weekends in particular, some distributions show negative values for unmeasured consumption. However, it is technically impossible for us to feed energy back here. How did this come about?

The unmeasured consumption is the difference between the inflows and outflows. A typical cause of negative values during off-peak periods is the fact that low consumption is also recorded in the outgoing area, but the incoming measurement does not “see” this due to the dimensions of the transformer.

Sometimes, individual meters are still read manually. Especially in some field offices. For example, the store manager should receive a reminder email at the end of the month. Is that possible?

Yes, that is very possible. Above all, by linking to the site calendar, you can ensure that the reminder arrives on time – for example, on the last workday. Of course, the email can include the link to the meter reading form right away. If the meter reader uses a smartphone, he can even enter the reading on site.

It should be possible to verify whether the visual energy reading still matches the meter reading after X m³ have been consumed, e.g., for water meters that are being monitored.

You can manually enter or change the meter readings T1 and T2 in a device via the Busmaster web. This is done via the device-specific commands.

You could therefore reset the meter reading in the device when changing the meter. Or, if an old meter is integrated, transfer its meter reading to the device. As a user, this does not work in every software version! In the meantime, “normal” users were excluded from the Busmaster web. If this is the case, you must either contact support or update visual energy accordingly.

To answer the question briefly and succinctly: Yes, you can.

First, use the Global Search in visual energy to find the metering point. Then you have two options:

Manual export

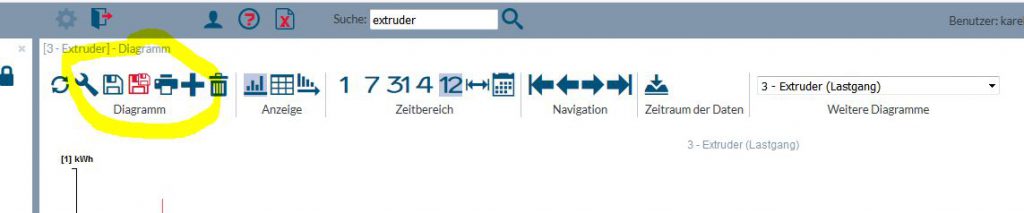
The “Data” button takes me to the “Level-time diagram” and here I can export the defined time range to a CSV file using the “Save as” button.

Automatic export

I can use the “CSV Export” workflow to assign this workflow to the meter point. The CSV file is then either saved in a server directory or sent by e-mail. If you want to regularly export data from several metering points or measured variables, the CSV data export (XML) workflow is ideal.

Have you saved a large number of level-time diagrams in the “Analysis” section, to the point where things are getting a bit cluttered? If so, there’s a way to organize them better.

To organize a level-time diagram into folders, click the padlock icon in the Project Explorer to open it. You can then create new folders with the right mouse button and move existing diagrams into them using drag-and-drop.

Have you installed a multimess D9-PQ in the distribution panel and connected it to the bus master via Ethernet?

The weekly EN 50160 reports are saved in the document folder of the metering point to which a multimess D9-PQ is assigned as a data source. You therefore only need to set up one metering point and associate it with the bus device. Nothing else needs to be configured. The 10-minute base values are read automatically, the PDF report is generated and saved in the visual energy document archive.

Each counter or measured value is identified in the visual energy system with one of the following status indicators:

  • Status 0 = original value; Note: Measured value comes directly from an (eBus) measuring device.
  • Status 1 = Replacement value; Note: Value has been edited by the system or a user.
  • Status 2 = provisional / planned value
  • Status 3 = disturbed value
  • Status 4 = missing value


Additional notes:

For sums – such as monthly totals – the sum is assigned the status of the individual value with the lowest status.
Individual values, totals, and reports with a status of 0 or 1 may be used for billing.

No, while you can use distribution charts to illustrate the supply structure, this is not strictly necessary to generate analyses. You can also simply create counting points and analyze the measurement data in this way. Virtual metering points can also be created and calculated on this basis. However, you do not have many automatic functions:

Distributions are used to automatically create (license-free) system counting points for the totals and differences.

The metering point types such as entry (supply company / distribution), exit (distribution / consumer) etc. are defined by the types of the drawing objects.

Only meter points of the consumer type can be assigned to cost centers.

The graphical representation of the supply structure allows allocations to be checked and errors to be detected much more quickly.

One of the most important performance features of visual energy is the plausibility of the data. The program therefore does not, for example, allow consumption to be assigned to a cost center more than once. This happens much more frequently than expected in conventional EDM systems. For example, if a metering point at the entry to a distribution and metering points at the exit of the distribution are assigned to the same cost center, you have exactly this case. However, visual energy knows the relative positions of the measurement points and thus prevents assignments that would lead to incorrect results.

visual energy - Licenses & Interfaces

Generally yes. It is the responsibility of the local administrators to ensure that communication remains possible in accordance with the communication scheme.

The officially supported interfaces are a WCF service for live and historical values, as well as the OPC (DA / UA) interfaces of the bus masters. All other accesses are not officially supported.

All products can be purchased and installed in your home.

The OPC option, which activates the OPC server and client functions, can be licensed for the basic bus master.

The Cloud option can be licensed for the visual energy base, which enables any number of projects to be created on one server.

Any number of additional metering points can be licensed for the visual energy base. Alternatively, you can also run your project in our cloud. The servers are operated in a certified data center in Germany.

Busmaster

Yes, if the gateway has been configured with a name and corresponding DHCP setting, the bus master can also address the segment via the name.

Example: There are a number of independent branches, but only a handful of measuring points are installed at each location. Is it still necessary to set up a separate system center for each location?

No, you can set up as many locations as you like per bus master. Each location can have its own time zone, but the total number of devices is limited to either 100 or 300, depending on the version.

Example: There is a large site with a large number of data collection devices. Can multiple bus masters be operated at a single site?

Yes, that is the plan. The busmasters synchronize with each other. General actions such as the switching of switching groups are carried out site-wide.

Example: Many locations are managed by multiple busmasters. Especially when a new bus master is added, existing locations should be migrated to the new bus master. Is that possible?

Yes, there is a function for this.

No, you can integrate as many system centers as you like.

In principle, the data sources CSV Import and MSCONS can be used directly by visual energy. However, the Busmaster software is required for the eBus, Modbus, Modbus-TCP, and OPC data sources.

N E W S
L E T T E R

Stay up-to-date on the latest topics in energy management. This technical report is published once a month.

Media library

KBR Youtube

YouTube

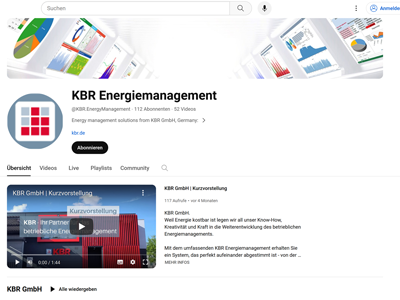
Immerse yourself in energy management. Exciting video tutorials on visual energy await you on YouTube. We will also take you on a virtual tour of our KBR plant.

KBR LinkedIn

LinkedIn

Don’t miss any news in the KBR network. Informative technical articles and updates on products, solutions, events and current topics await you.

KBR Instagram

Instagram

Get to know KBR from our private side. The stories regularly feature fascinating insights from our day-to-day work and internal events.