Degree day figures & heating monitoring
Our aim is to use visual energy 5 to monitor our heating control system, which should switch on automatically when the outside temperature reaches 15°C (and below).
The heating degree days and degree day figures form the basis for this, as we calculate these in the first step. The subsequent graphical display allows us to see immediately on which days we had to heat. In the next article, we will also display our gas meter and the consumption of the new heat pump, as these two consumers are responsible for heating in our company.
If we now recognize a gas consumption or consumption of the heat pump on days on which the heating degree day is 0 Kd (unit Kd: Kelvin day), we have a consumption on a non-heating day and therefore an unnecessary consumption. This consumption must be eliminated afterwards or reduced to the bare minimum. But let’s start with the basics:
What is a heating degree day and a degree day number?
A heating day is first defined for this purpose. A heating day is a day on which the average outside temperature is below the specified heating limit temperature (usually 15 °C in Germany). For a heating degree day, the differences between the heating limit temperature and the average outside temperature on heating days are formed and often added up to a monthly or annual value. For a degree day number, the difference between the indoor room temperature (usually 20 °C in Germany) and the average outdoor temperature is calculated.
Example: average outside temperature for a day is 7.4°C
Heating degree day: 15 °C – 7.4 °C = 7.6 Kd (unit: Kelvin day)
Degree day number: 20 °C – 7.4 °C = 12.6 Kd (unit: Kelvin day)
This value is often added to a monthly or annual value so that it is easier to compare these periods and, for example, the heating costs incurred here.
The definition of the difference between heating degree day and degree day number is often not clearly defined, especially in international dealings, so that we always refer to degree day numbers in the following and in our software and refer to the difference between the heating limit temperature (15 °C) and the outside temperature.
Illustration in visual energy 5
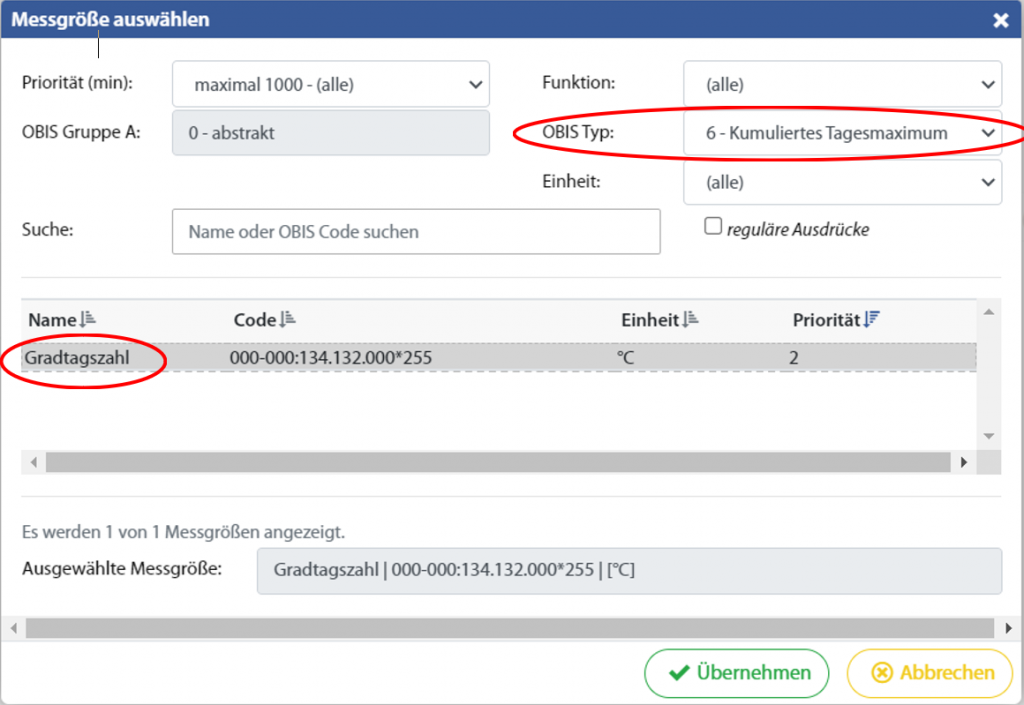
In the first step, we therefore want to create a diagram in which we display the average outside temperature and the degree day figures. The average outdoor temperature is measured by an outdoor sensor and transmitted to ve5 via the connection to our multisio. The degree day number is simply calculated from the measured outdoor temperature via a workflow. This takes place in the detection range of visual energy 5 under the metering point of the outside temperature. On the one hand, the degree day number must be added as a measured variable under the OBIS measured variables, whereby it must be ensured that the cumulative daily maximum is specified as the OBIS type.
Selection of the measured variable
On the other hand, the temperature (mean value) must be added as a measured variable at the same point. This is because the calculation of the degree day number is only possible in this OBIS indicator ‘Temperature(mean value)’ (000-000:128,128,000*255). The workflow Calculate degree day number per day can then be created in the workflow area via Add assignment by editing this measured variable[Temperature (mean value)]. Among other things, the heating limit can be set manually here (recommendation: 15 °C) and the workflow can then be saved and executed. The familiar time programs for executing the workflow are available as usual.
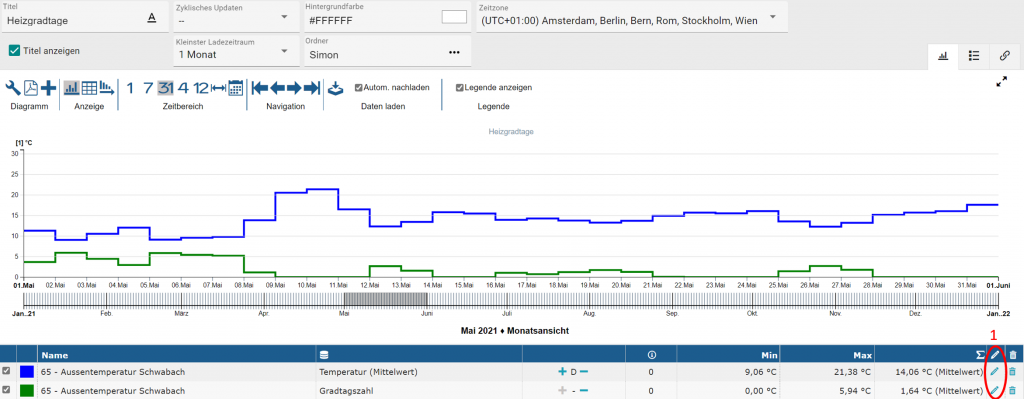
Finally, the degree day number and the outside temperature are entered into a diagram – a level-time diagram – in the evaluation area: The example of the resulting degree day number for the month of May is shown below. The average daily outdoor temperature is shown in blue and the number of degree days in green. The latter is of course 0 Kd for all days on which the average outside temperature is above 15 °C. These are the days on which heating is not usually required. For the settings(1 – marked in red) of the two counting points, we recommend setting the line type to stepped so that the days are better differentiated from each other.
Display of the outside temperature and degree day figures in a level-time diagram
In our next blog post on this topic, we will go beyond the basics and take a closer look at our degree day figures with the help of some “heating consumers” (including our heat pump). The aim will be to quickly and easily determine the need to optimize the “heating consumers”.
Your visual energy Team


