Part2 – Today’s topic: Monitoring the internal heating control system
Heating costs a lot of energy and money. If you are not careful, many resources are literally “burned up”. This makes it all the more important to prevent unnecessary consumption. In this article, you will therefore learn how to monitor your heating control system with visual energy 5.
As an example, let’s take KBR’s own heating control system, which switches on automatically when the outside temperature drops below 15°C.
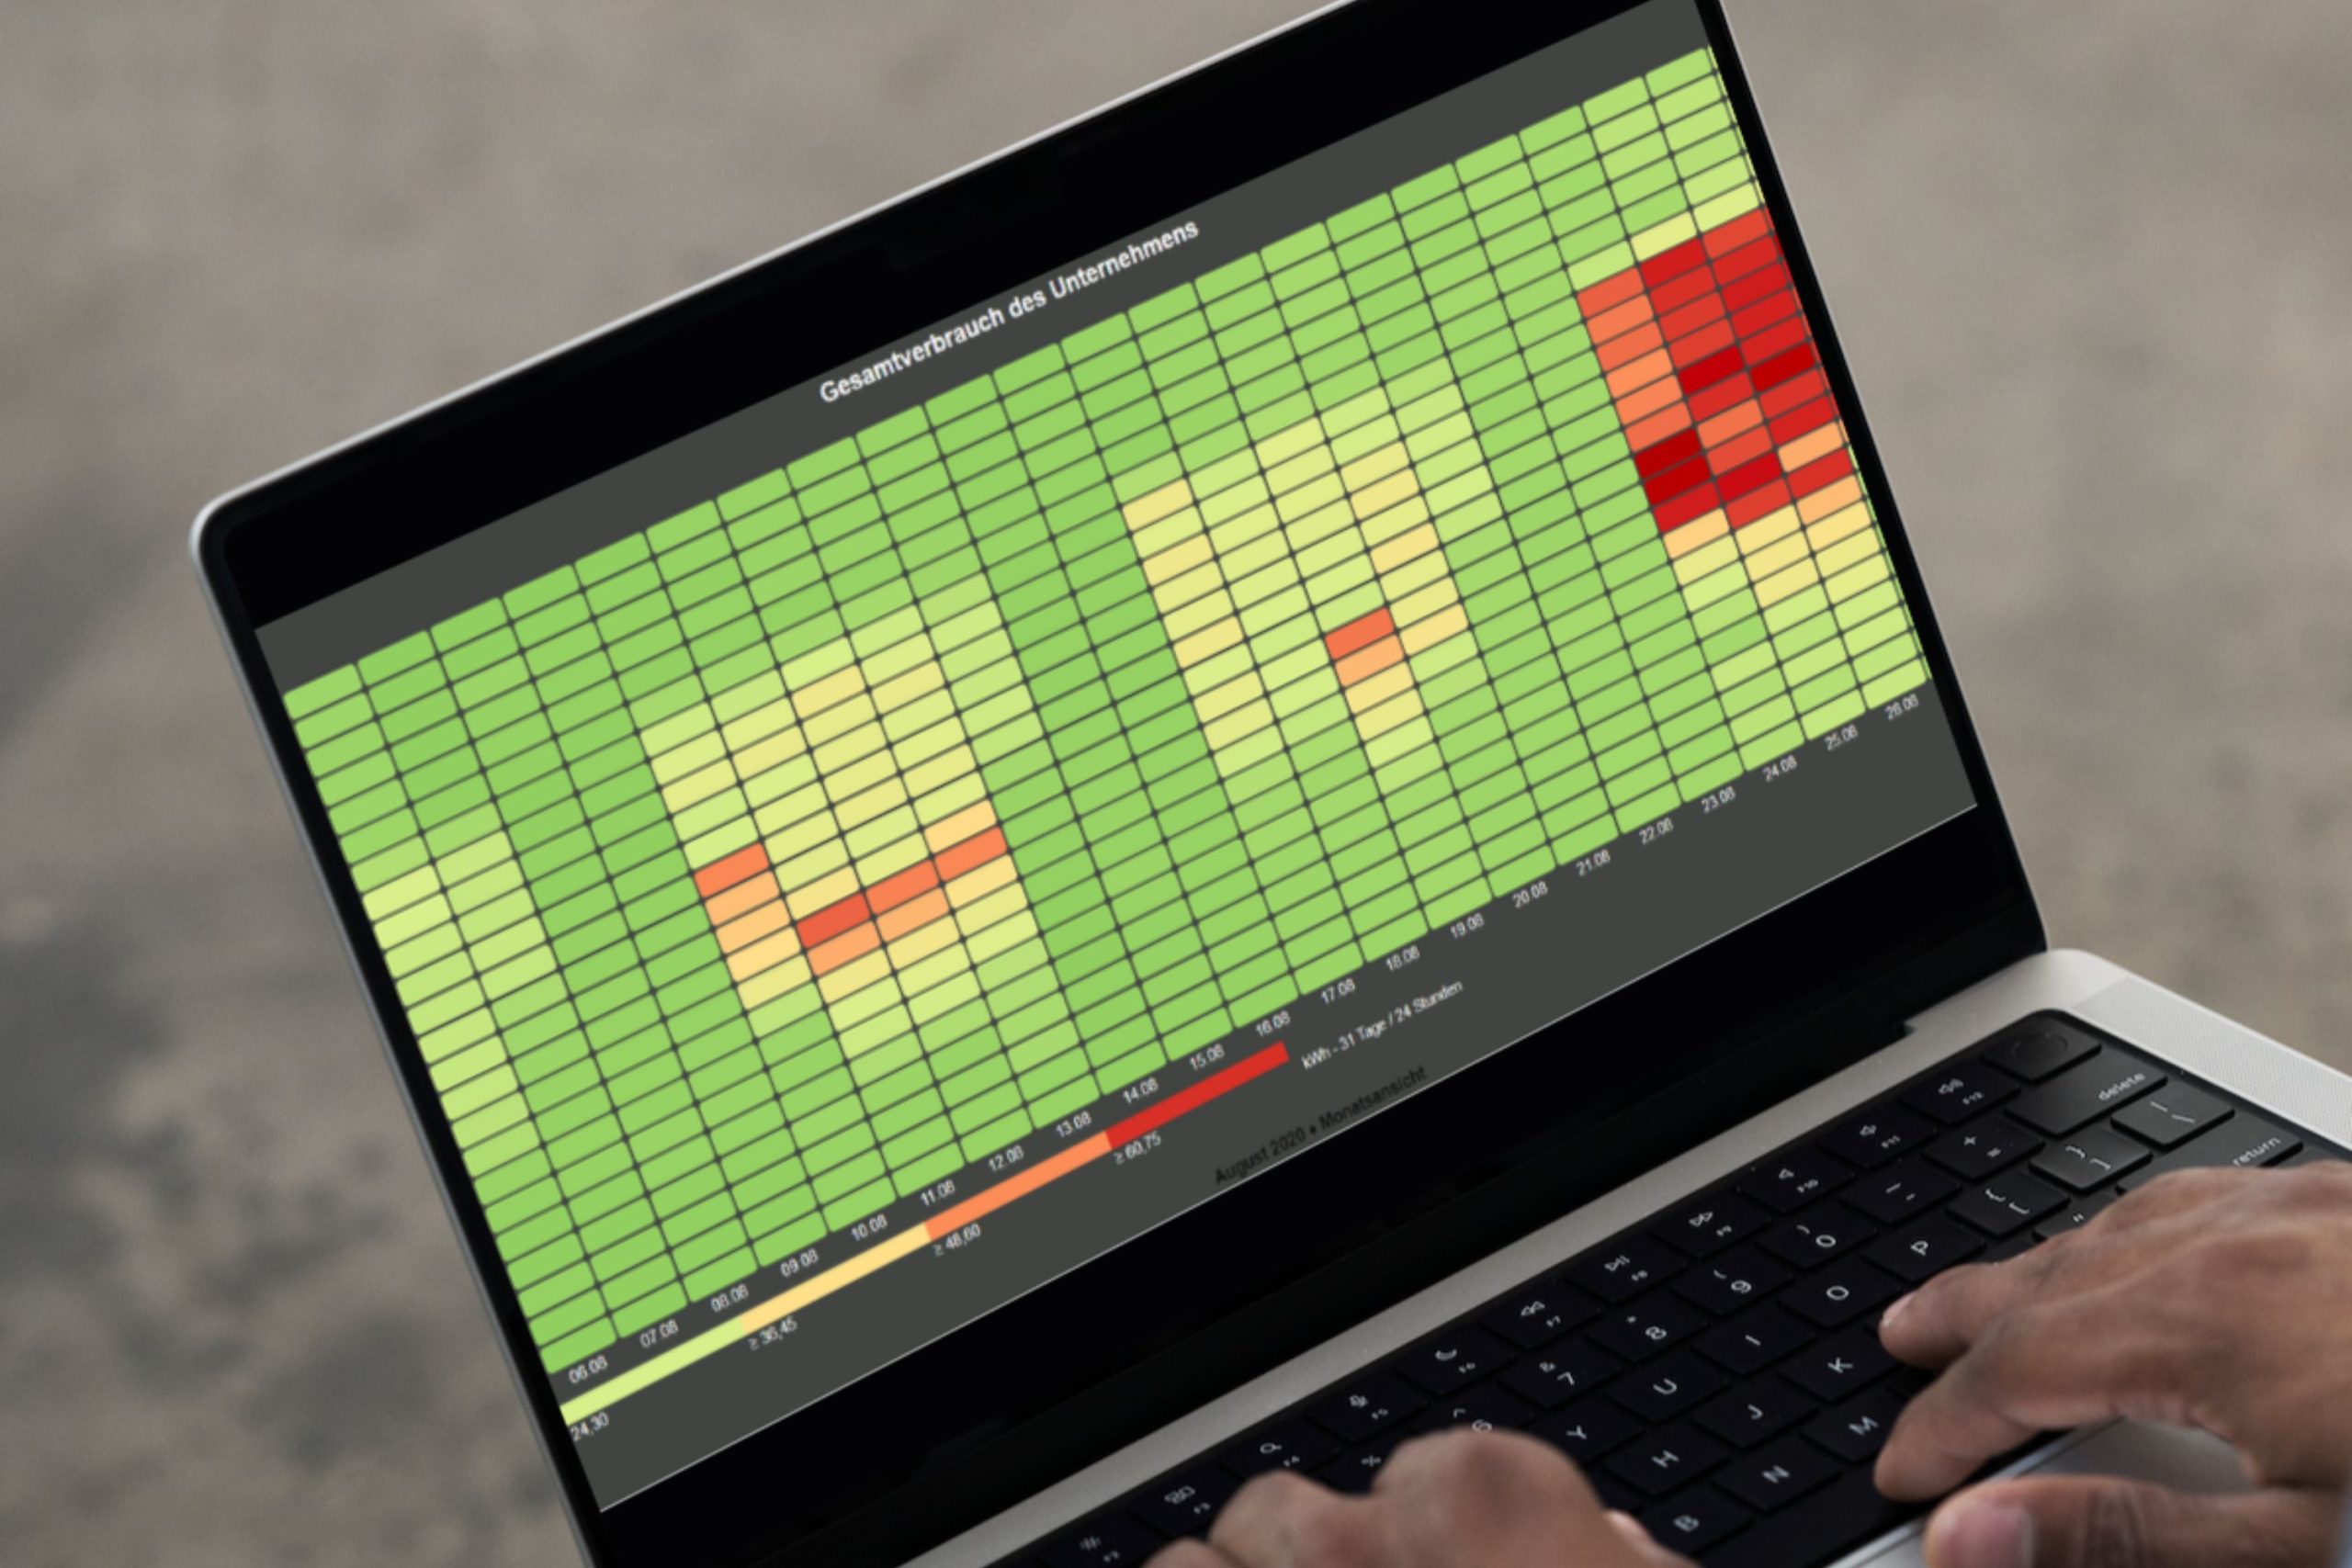
The graphical representation of the heating degree days in visual energy allows us to see at a glance on which days the outside temperature was so low that heating was required. In addition, we display the consumers responsible for heating. In this case, our gas meter and the consumption of the new heat pump.
Unnecessary consumption can now be easily detected. If there is gas consumption or heat pump consumption on heating degree days with 0 Kd (Kelvin day), i.e. on a non-heating day, we therefore have unnecessary consumption. This consumption must be eliminated in the future.
A more detailed explanation of the terms heating degree day and degree day number can be found in the previous article visual energy 5 in detail: Degree day number – Part 1.
Illustration in visual energy 5
So what is needed to carry out the following steps?
The measurement and integration of the outside temperature and your own “heating consumers” in visual energy 5.
The second step is to select the metering point for the outdoor temperature and the degree day number in the detection area – depending on your own structure. Here you add the daily values as a degree day number via the “Calculate degree day number per day” workflow so that the degree day number appears as a cumulative daily maximum under the OBIS measured variables of the measured outdoor temperature.
Now we create a level-time diagram in the evaluation area. he outdoor temperature and the degree day are now added via Add channel. It is important to select the right location, the right medium and then the right OBIS for the selected temperature counting point.

Add heating consumer
Now the “heating consumers” are still missing for the comparison, in our case for example the heat pump and the gas meter point. These consumers are also added to the diagram using the method just described. The diagram can now look like this:

The selected time range covers the beginning of May to the end of July. The two temperatures (green and blue line) are aligned with the left y-axis. The two consumers on the right y-axis. You can see very quickly that we still had gas consumption for a few days at the end of May, even though – by definition – these are no longer heating days (blue line above 15 °C, green line at 0). It can also be seen that from the end of July, heat pump 1 becomes visible with a consumption of approx. 10 kWh – despite an outside temperature of over 20 °C.
Conclusion
It may therefore be that the heat pump automation needs to be adapted. On the other hand, it may be that other processes in the company require the heat from the heat pump. This cannot be clearly determined without knowledge of the machine or process. It is therefore now necessary to clarify consumption with the responsible colleagues and optimize the heating automation if necessary.
Your visual energy Team