In the “visual energy series5 in detail” series, today we want to take a look at the new “Measure” function.
visual energy Version5 has been launched to provide even better support for energy managers in companies in their daily work. Many specialized tools are available for recording and analyzing energy data.
A new feature is that the organization of specific savings measures is now also supported.
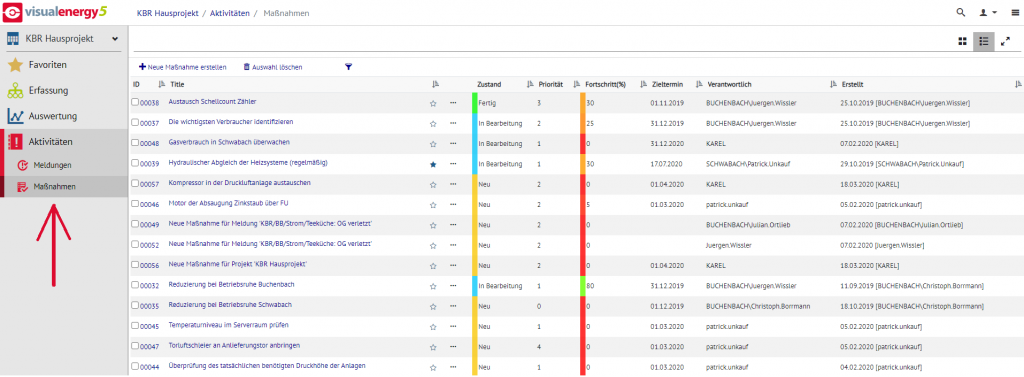
This tool can be found under “Activities” -> “Measures”.
Here, authorized users can create any measures and organize their implementation. The list shows, among other things, the title of the measure, the person responsible, as well as the status and progress of implementation. Of course, the list can be sorted or filtered.
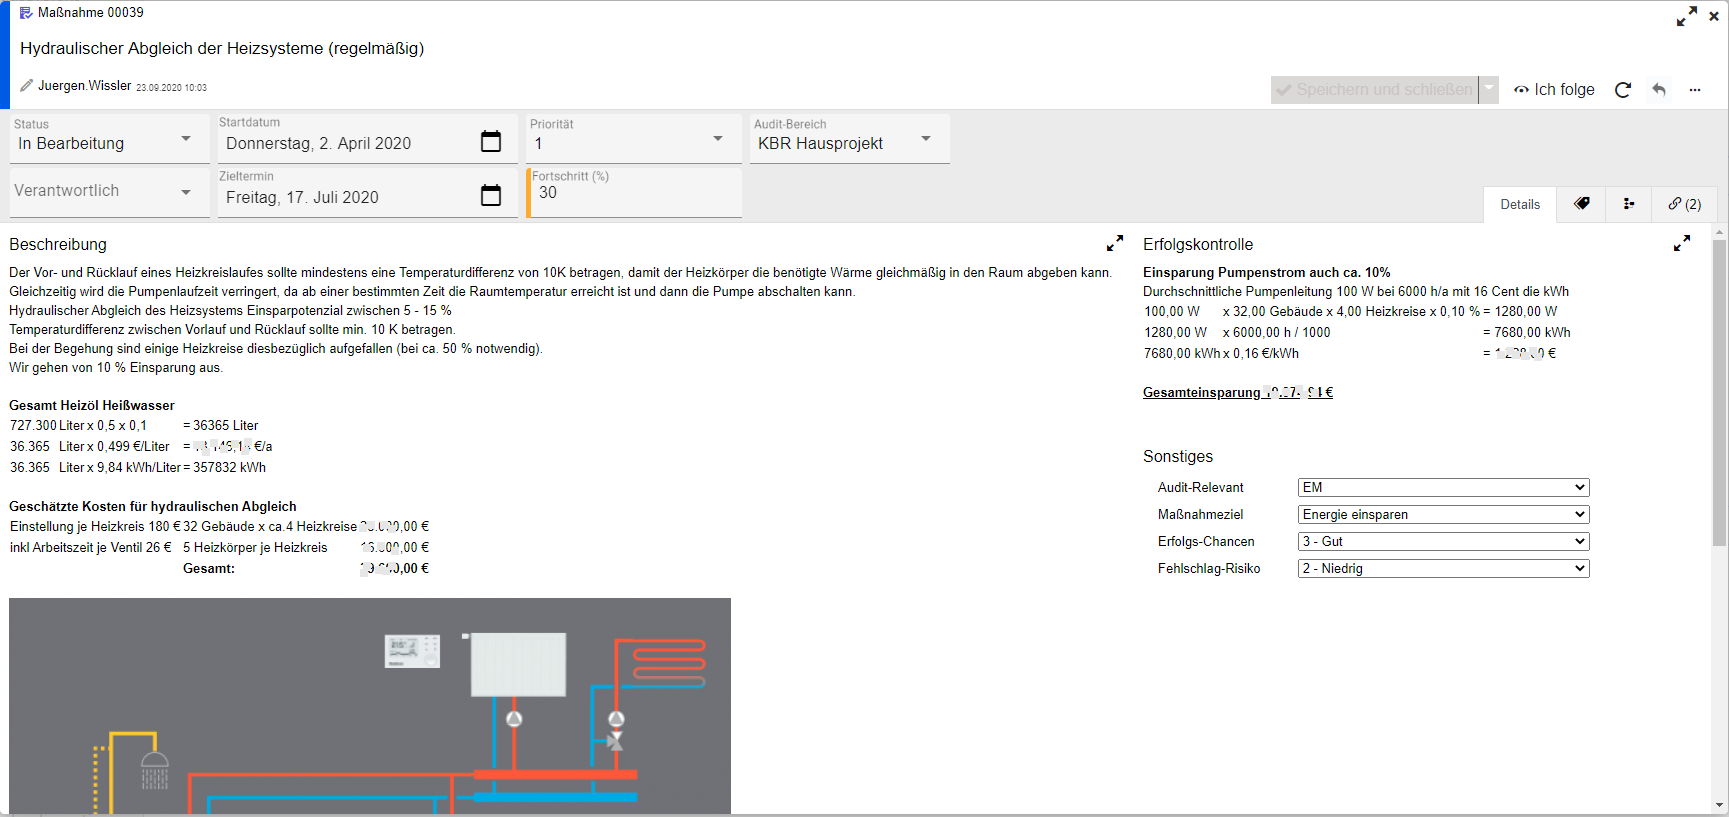
Let’s look at one individual measure in detail. visual energy5 typically lists all properties on a clearly arranged map. It starts with a meaningful title. This is followed by the form fields for the status (New, In progress, Completed), the priority (0-4), the start and target date, the employee responsible, the progress (0-100%) and the audit area.
All fields are currently only changed manually by the user. This means, for example, that progress is not automatically determined by the system, but by the user.
Convenient text editor
This is followed by the “large” fields for the description of the measure, for opportunities and risks and for monitoring success. These fields offer sufficient space for text with tables and images. An integrated HTML editor ensures convenient editing:
This allows the measure to be described in detail and the progress and success to be documented for the audit. The form is rounded off with the selection fields for the audit relevance (EM, QM, UM), the measure objective, the chances of success (0-none to 5-excellent) and the risk of failure (0-high, 1-moderate, 2-low). This allows the measure to be assessed.
Cross-references with links
Links to counting points, diagrams or other documents in the system can be added to any measure. This allows you to go from the measure to the required evaluation diagrams with a single click and vice versa, for example from the metering point to the assigned measures. PDF reports or other saved documents can also be linked here.
Tracking
Typically, the energy team or an energy manager creates a measure and then assigns it to the responsible employee. The “Follow” function is very helpful here. One click is all it takes to be informed of any changes to this measure by e-mail.
Conclusion
Instead of using Excel to keep lists, visual energy offers a clean solution for organizing and documenting the measures. This provides important support and ultimately also simplifies auditing.
Your visual energy Team
