Current situation:
Three Nuremberg swimming pools had to close for a fixed period, many cities are restricting their monument lighting and the city of Augsburg, for example, is expecting a cost increase of 12.4 million euros for electricity, natural gas, district heating and energy services in 2022. As a result, we are now realizing how important it is to act and live in an energy-efficient way.
We often read that companies or local authorities are now examining where they can save energy. But where should they start? How do they know where they can make really big savings? Companies in particular cannot simply switch off their machines and shut down their production.
Avoid flying blind
It is important not to proceed blindly here, but to carry out a potential analysis first. Switching off lights for a short time or reducing the automatically set room temperature by 1-2 degrees in the cold months does bring some savings. But you will never know how high the savings really are if they, or the consumers, are not measured. You can often make big savings with simple changes. However, in order to proceed efficiently, you should first clarify where the savings potential lies, how high it is and how it can be achieved most effectively.
What do I need to find my savings potential?
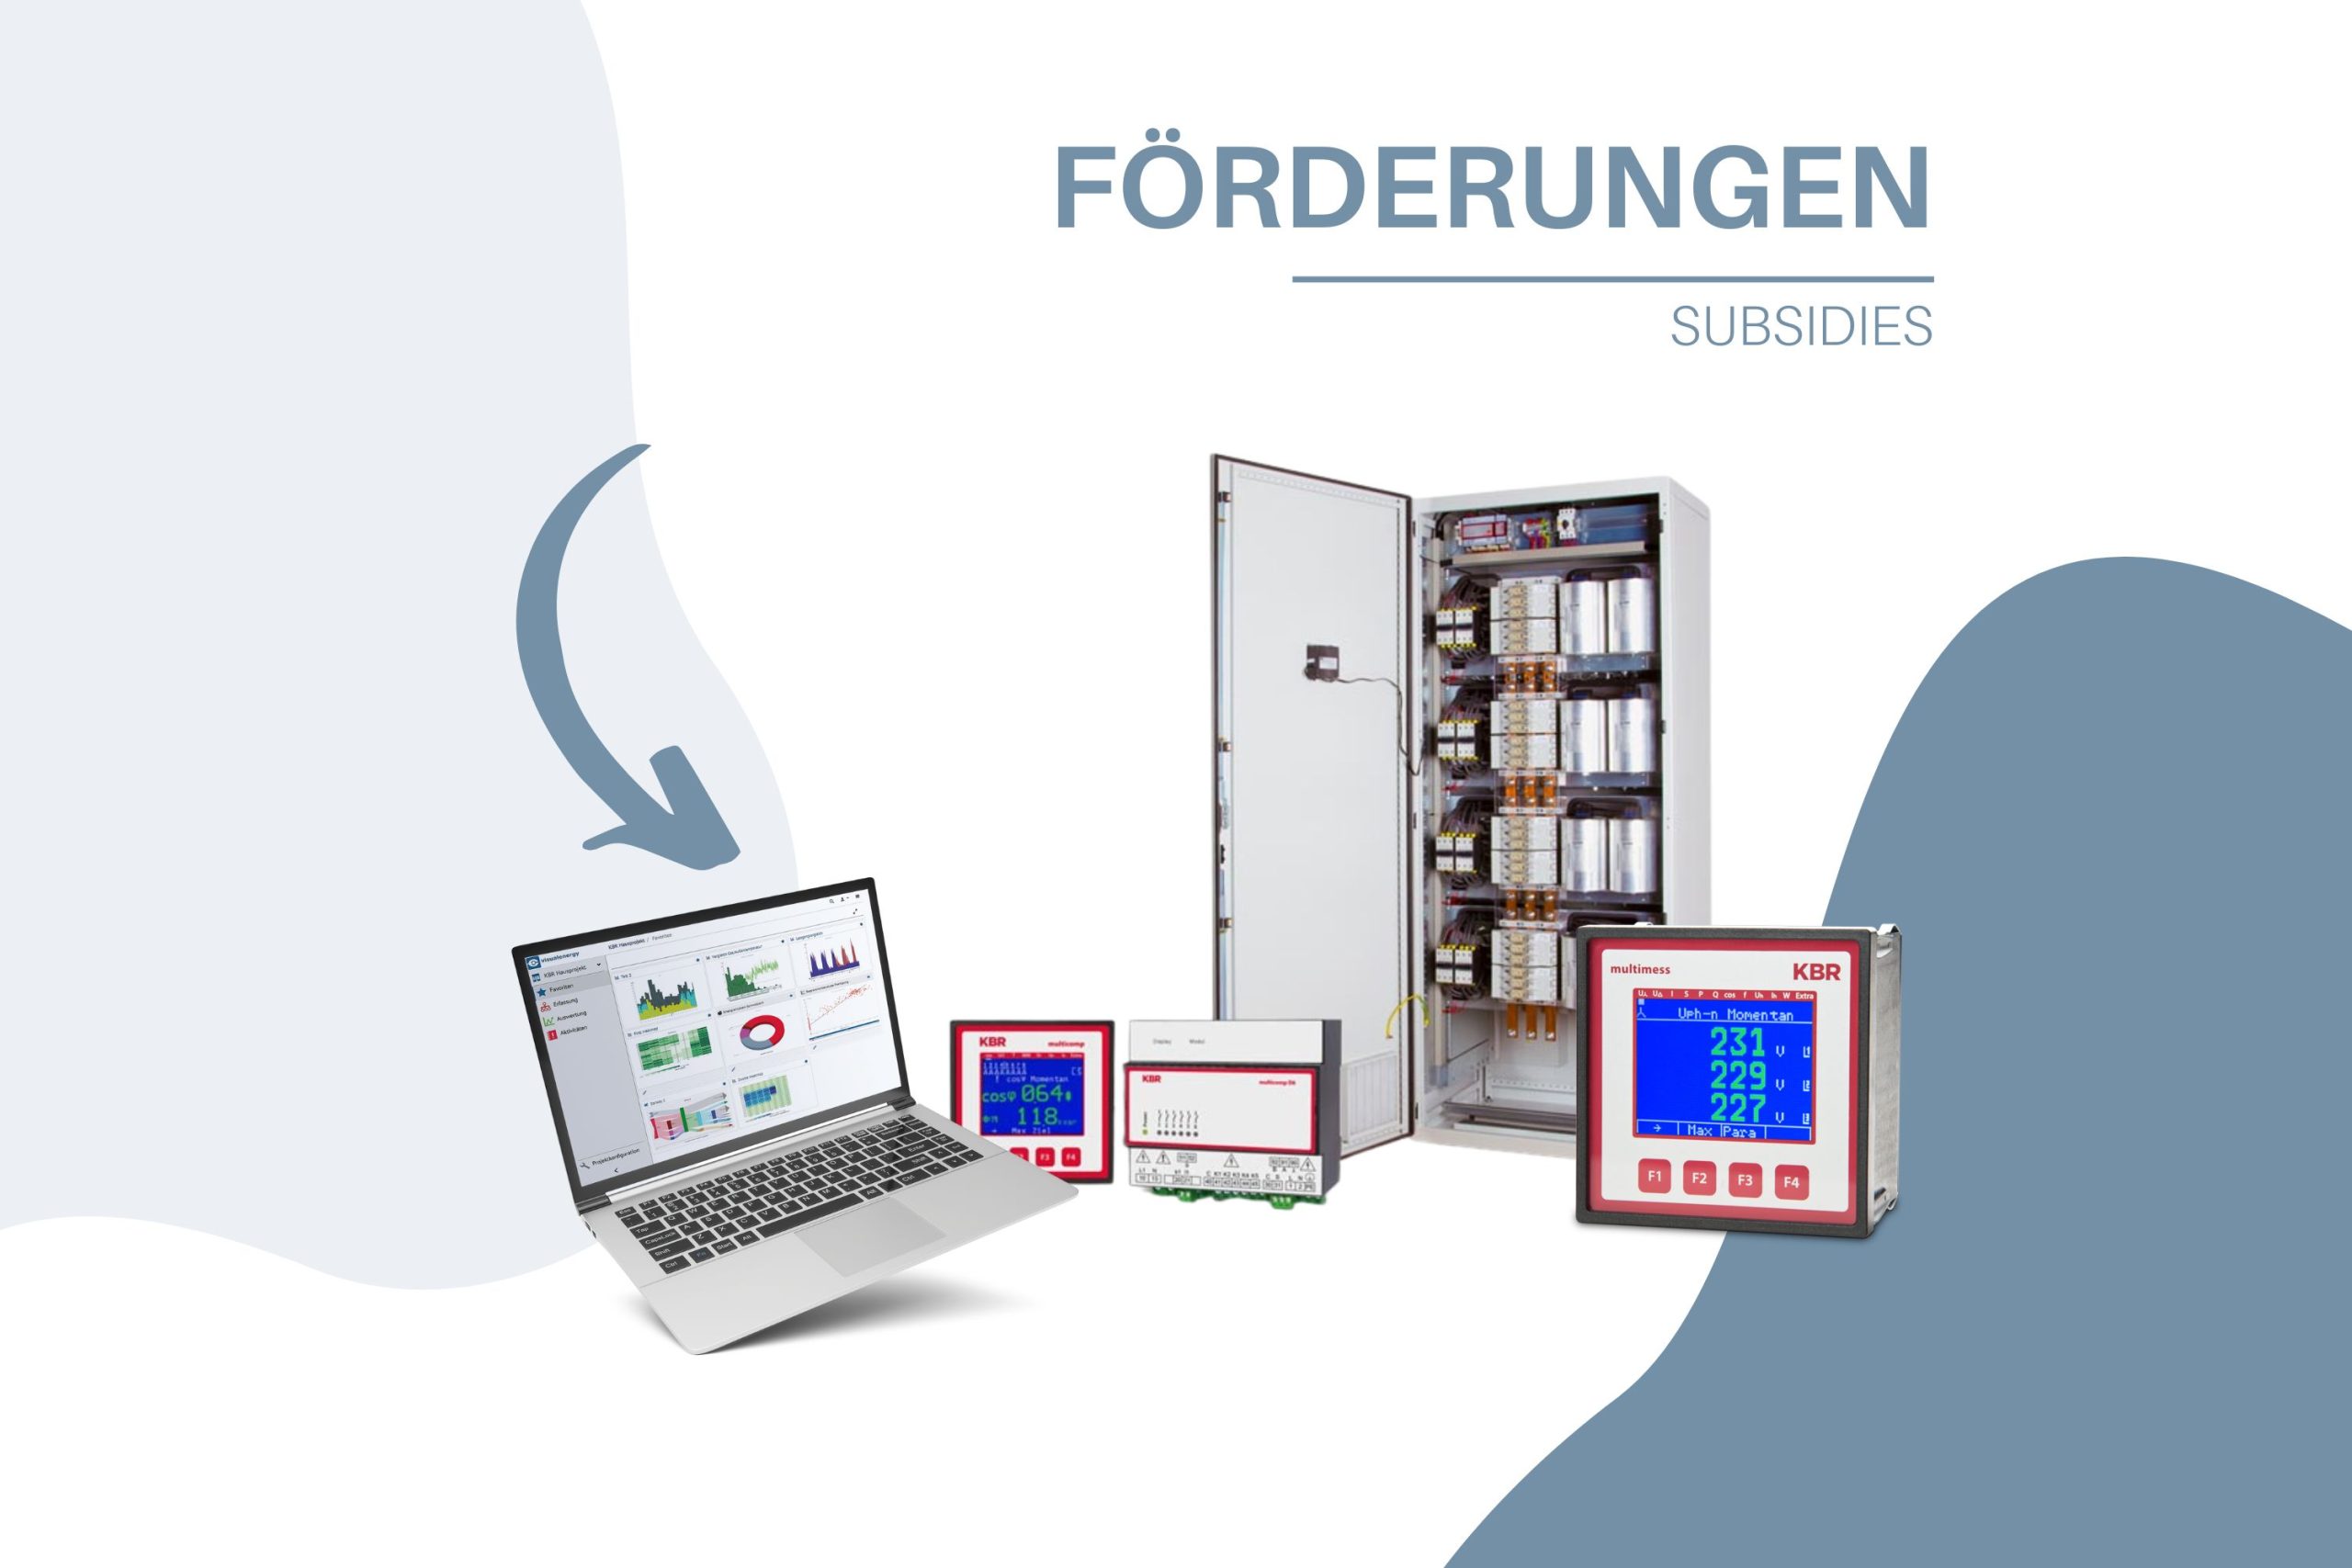
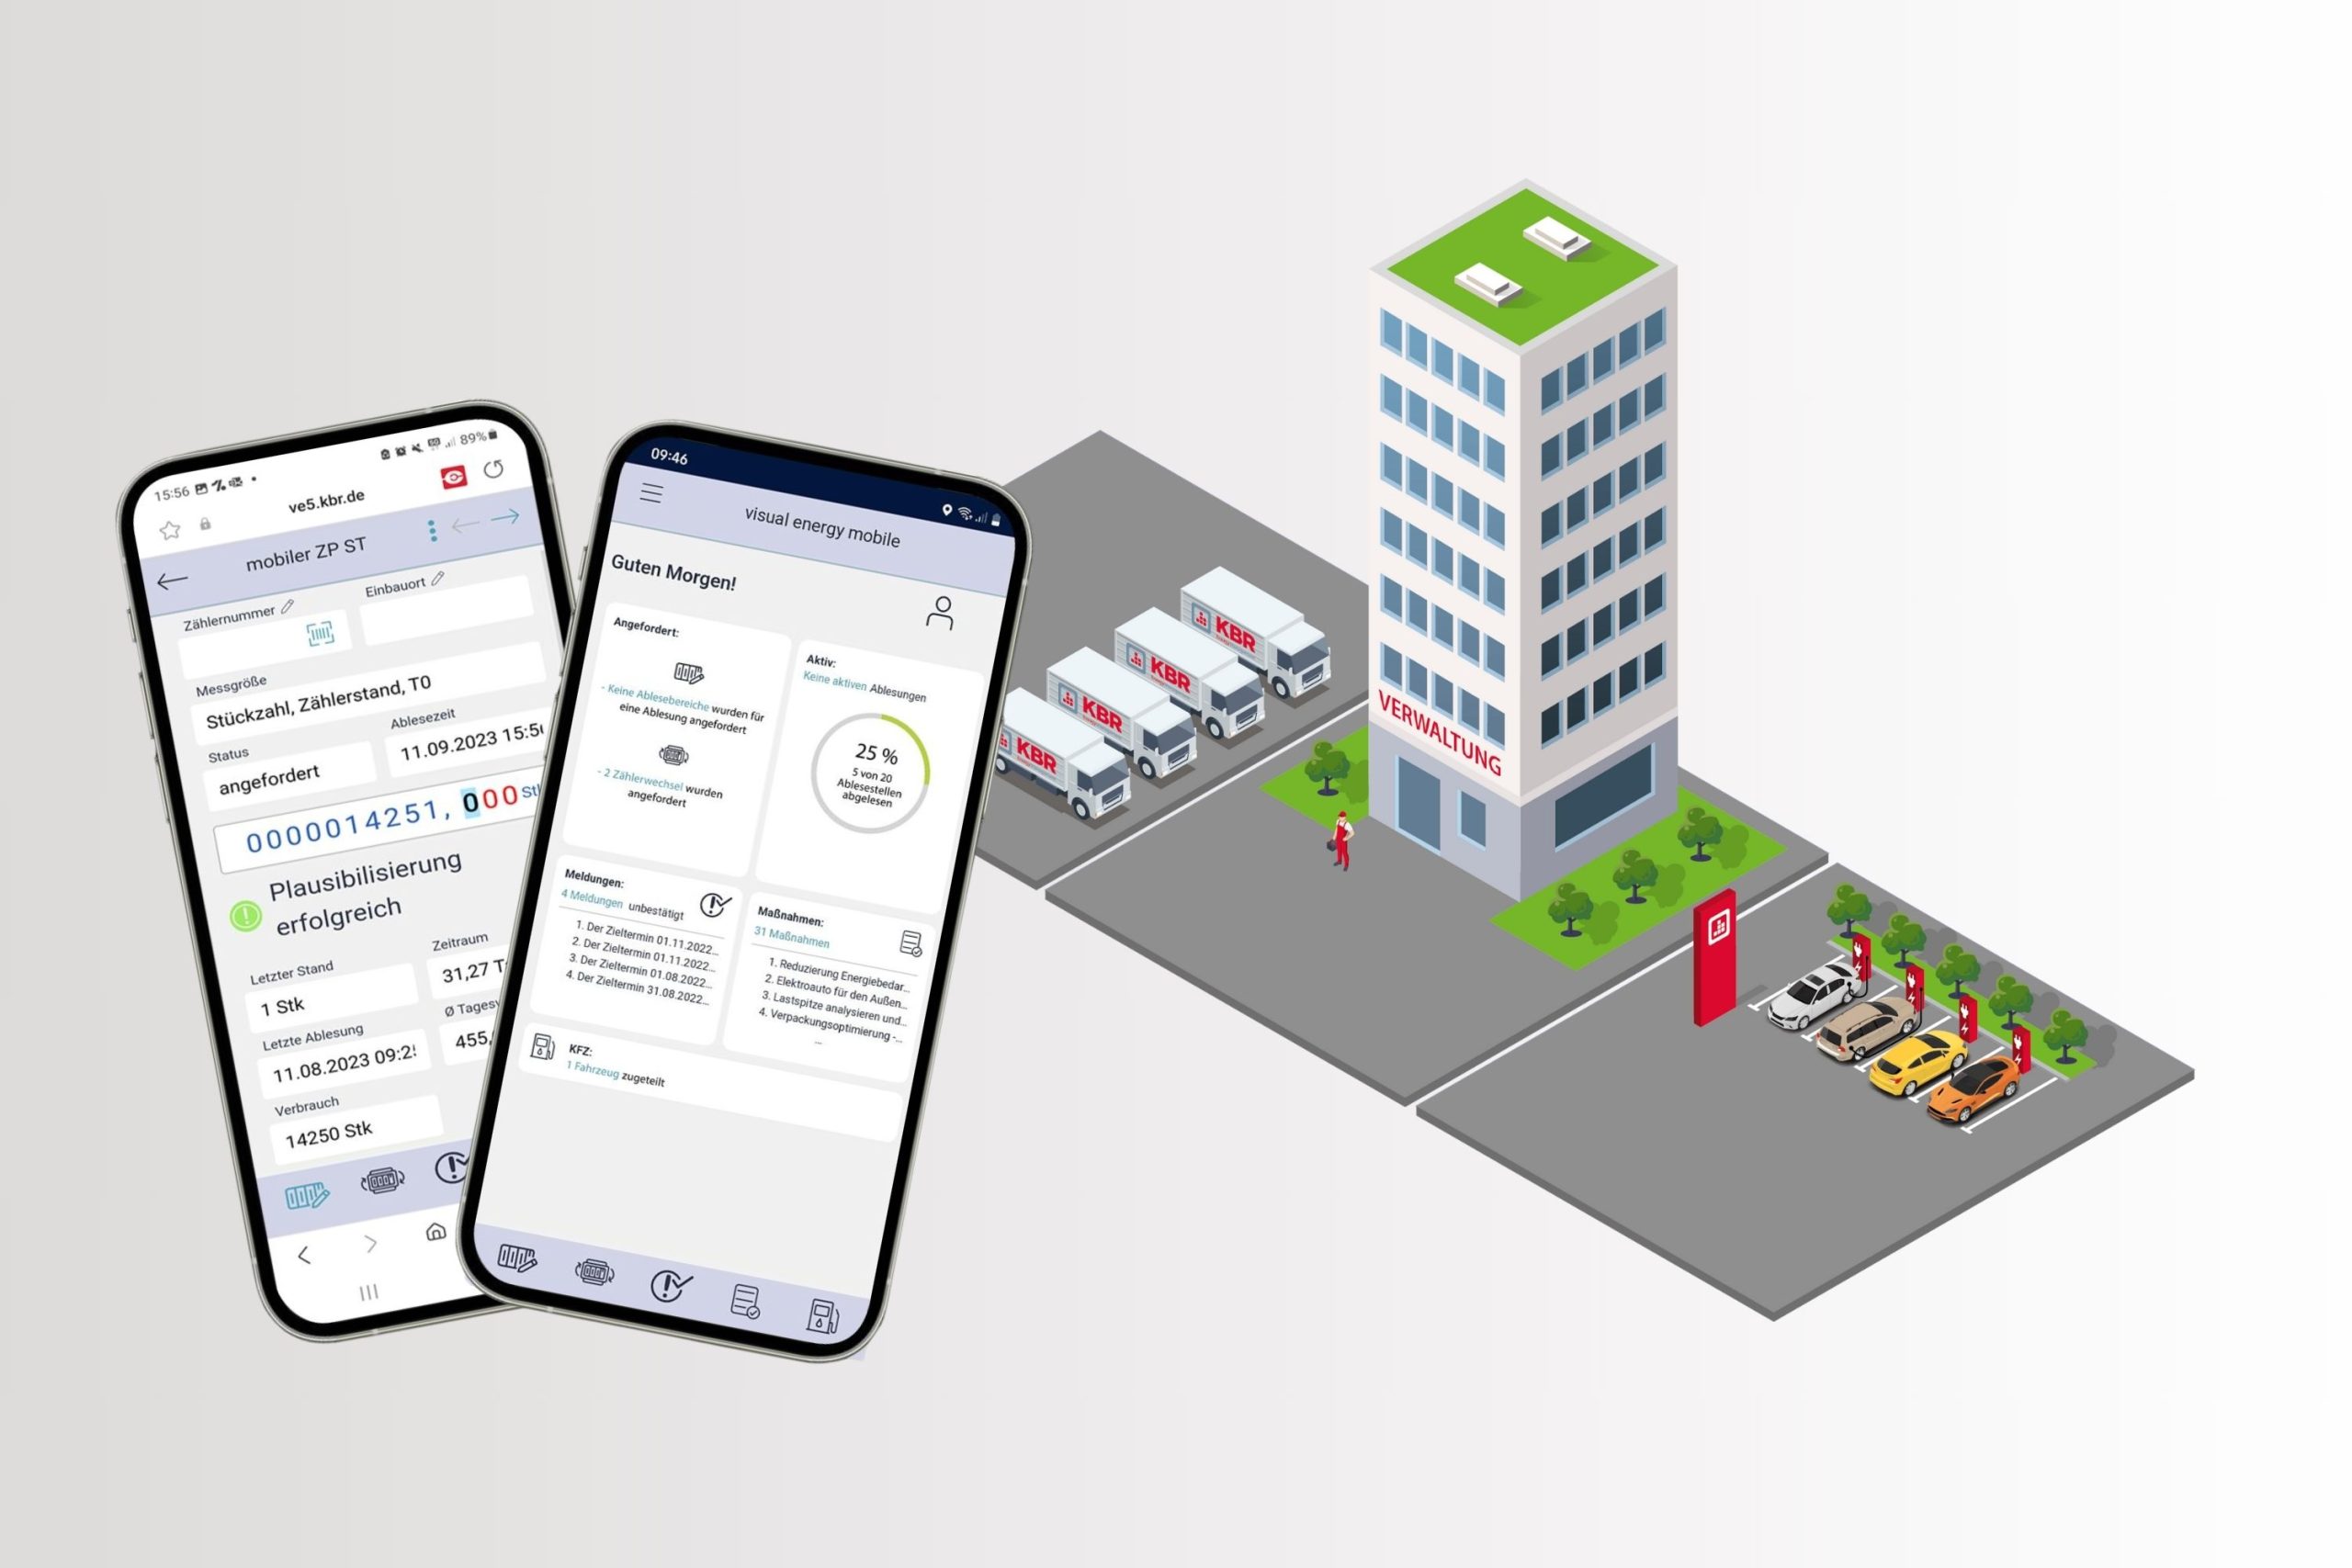
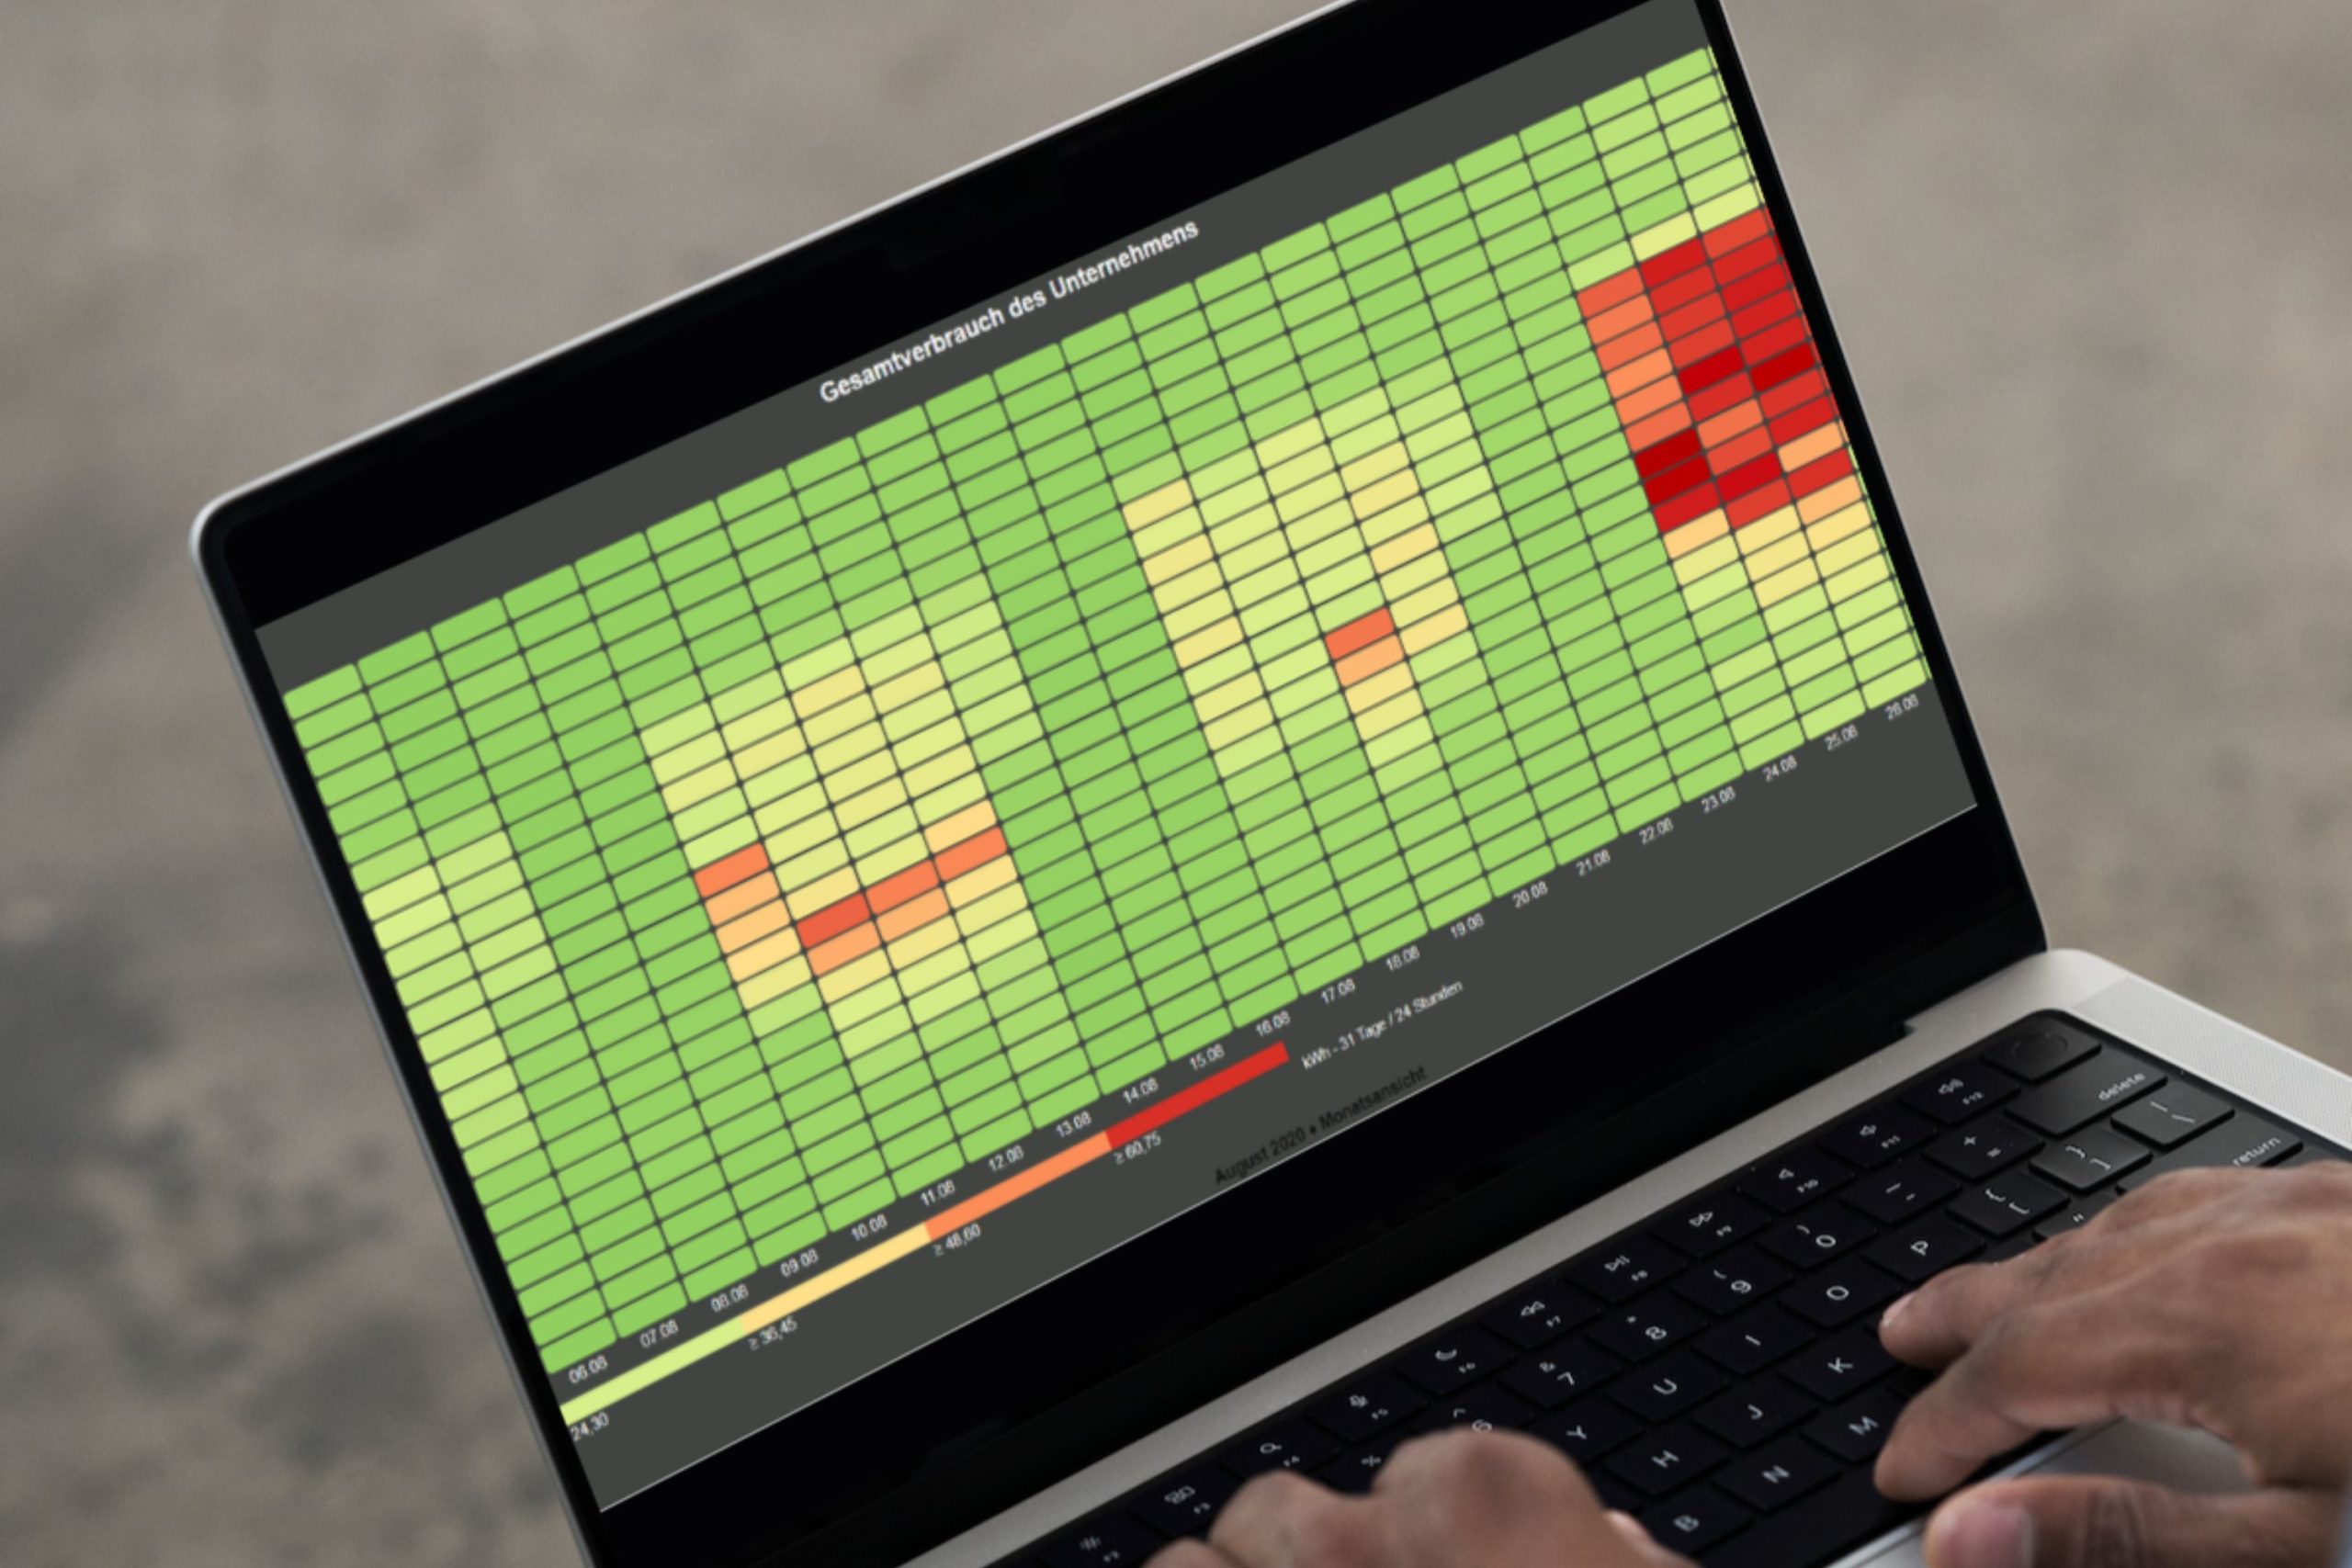
Energy data management (EDM for short) is the solution here. Various media such as electricity, gas, water, heat and much more can be recorded and clearly visualized in the long term. By analyzing this consumption data, the operator can see where savings can be made. An example tool of an EDM is the SEU list. for Significant Energy Use) from visual energy 5. It shows the significant consumers that account for a significant proportion of total energy consumption and often include certain machines or systems that can be optimized in their operation. An EDM system also offers many other analysis tools that help every energy manager to find the savings potential they are looking for and reduce operating costs. Whether dashboards, heat maps, regression analyses, simple key figures and much more. There is a huge range of tools to choose from, so everyone can find the right one for them.

Dashboard of visual energy 5 on a tablet
The fact that the implementation of an EDM system can even be subsidized by BAFA or that it makes a lot of work easier during the ISO 50001 audit are two further arguments in favor of implementing it.
In conclusion, I can only ask you the question with regard to your energy efficiency and possible savings potential: What are you waiting for? When will you get to know your own savings potential?
Your visual energy Team