The key figures are an important part of the daily work of every energy manager. Often, the company’s own managing director or some production partners also specify or calculate certain key figures. These required key figures include, for example, the amount of energy or power consumption per unit or per working day.
The possibility to create such a key figure is given in visual energy 5, so that I can always correlate any variables with each other and get the key figure I am looking for.
Not only measured counting points can be used for this, but also certain variables such as production quantities, working days, areas and many more. These variables therefore form the basis of the key figures and are referred to below as basic variables.
Preparation for the creation of key figures
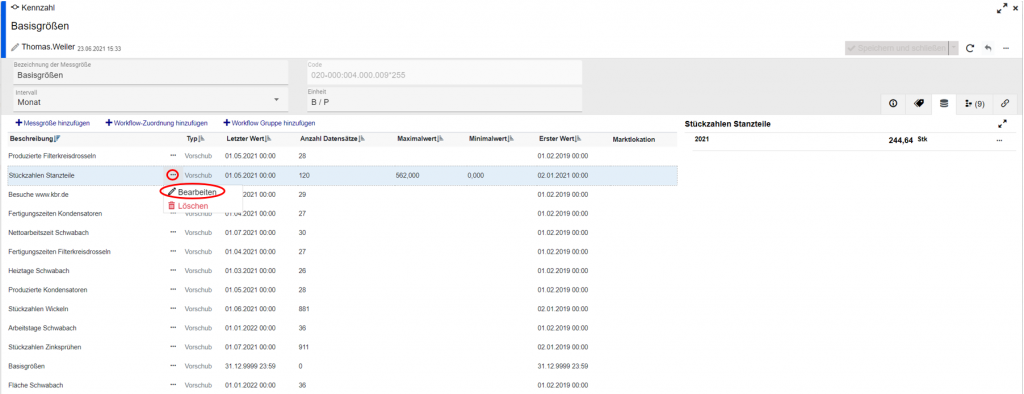
In the area of Evaluation you will find the sub-item Key figures. As soon as you click on it, all your key figures are listed. About Add you can create new key figures. First, however, we need a base figure in order to incorporate our own production data into the key figure. As one of the key figures, you will also find the key figure basic variables.
We have created these in our own project in order to collect all the basic variables there. As you can freely determine your structure, you can also create a key figure for this and enter your basic variables as measured variables collected there. To assign data to your base size, click on the point symbol associated with the selected base size. point symbol and then click on Edit.
In the following window, you can add further data manually via . At this point, the data can also be imported using a workflow via a CSV file. You can find out how easy it is to create and use this CSV import in our video explaining the key figures.
Creation of the key figure
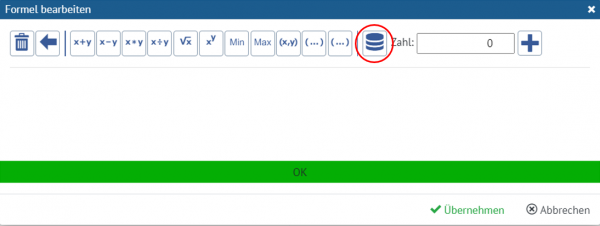
To combine this base variable with a measured meter point, for example, or to calculate a key figure, we go back to our previous view or the view of our key figures and select Add. Another window now opens in which you can name your key figure and assign it a unit. Under Calculation you will find a formula editor, which you can access via .
In this editor, you can enter your calculation formula with which you can correlate your meter points and base values. All basic calculation types are available to you by clicking on the respective symbol. You can insert your meter points and base sizes using the icon marked in red.
Finally, confirm your formula by clicking on Apply and save it in the following window.
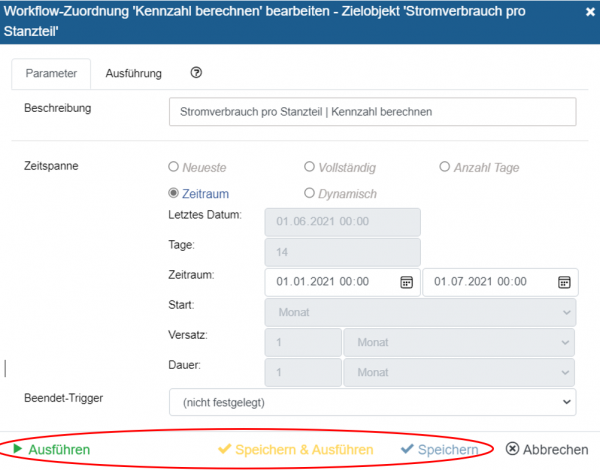
The calculation of the key figure is again performed by a workflow, which can be accessed via Edit can be customized.
It can now be provided with manual schedules and execution triggers so that the workflow can be executed automatically again and again and the key figure is updated automatically. Then all you have to do is save and/or execute.
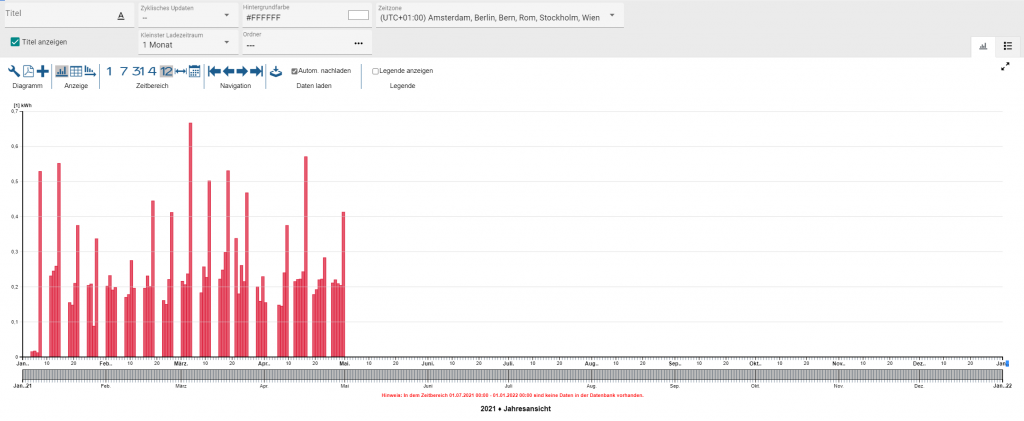
Finally, you can output your key figure not only in the familiar display option as a number, but also as a level-time diagram, among other things.
Below you can now see the created key figure as a level-time diagram:
These were all the steps required to create and graphically display a key figure. Also take a look at our explanatory video. Here we create a key figure step by step and you will quickly and easily arrive at your first key figure.
Your visual energy team

