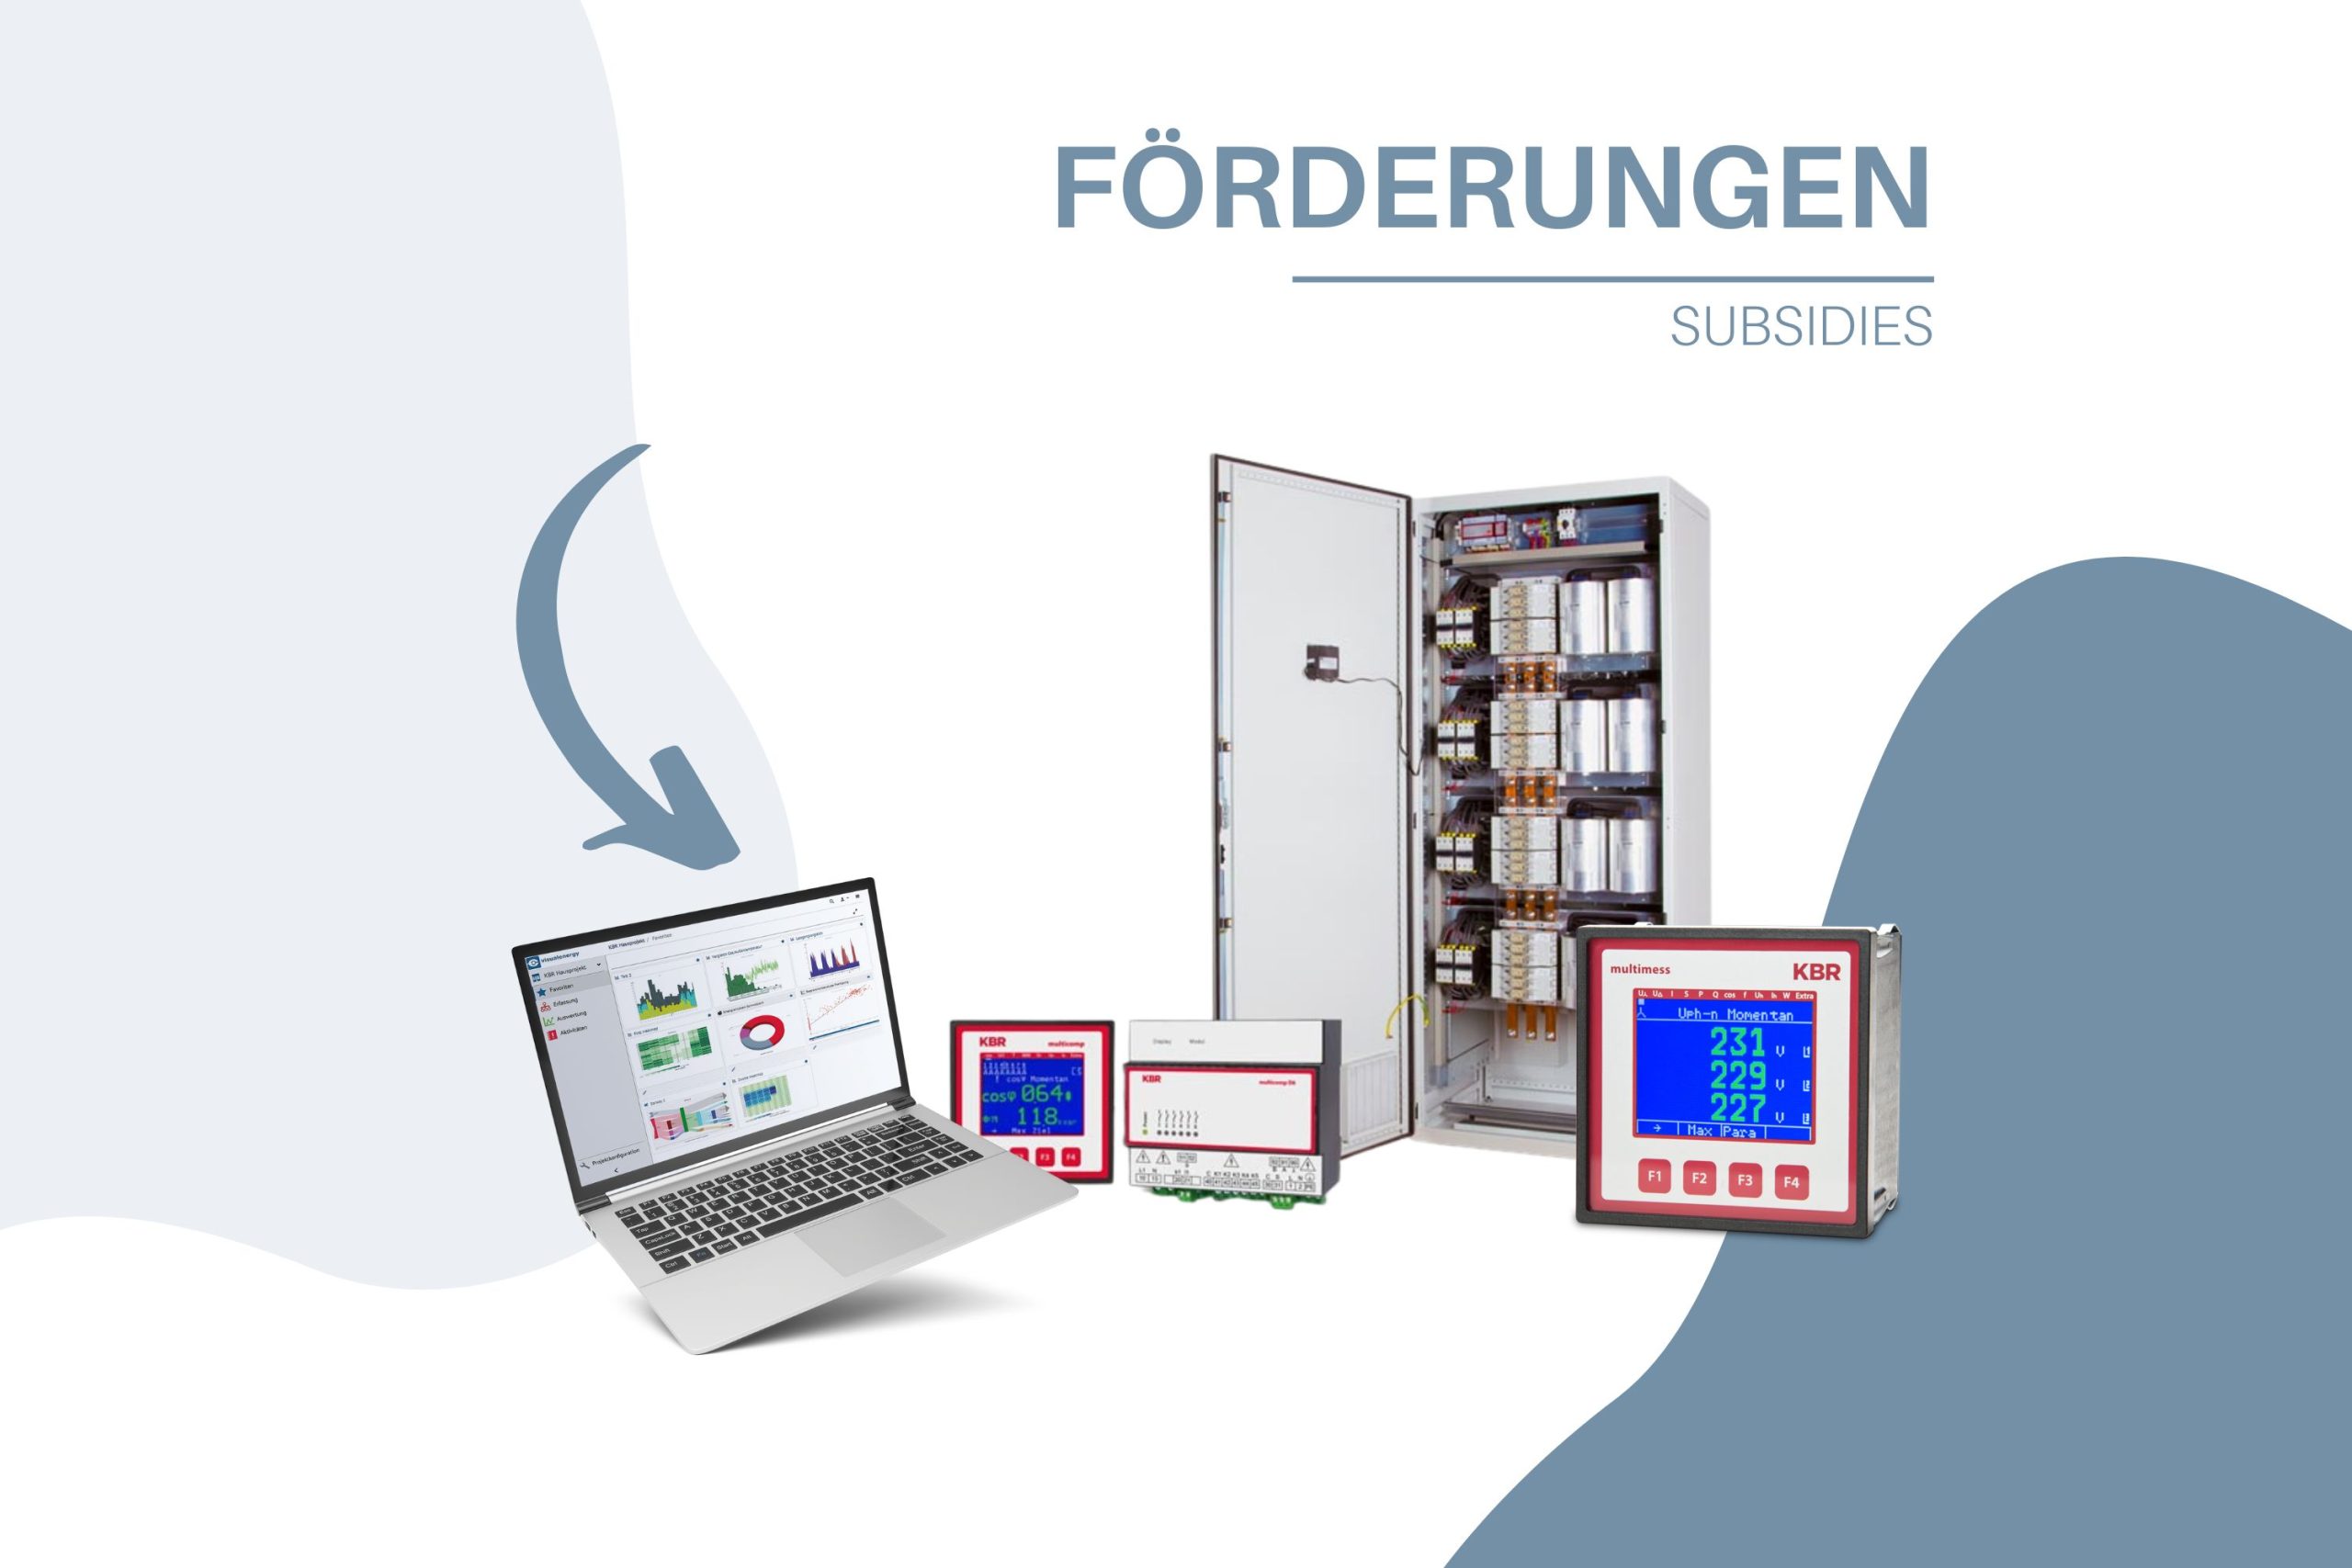
In today’s “visual energy 5 in detail” series, we take a look at the new “Regression analysis” function.
Regression analysis is a statistical method for modeling relationships between different variables. On the one hand, it is used to describe and analyze relationships in data. On the other hand, to make predictions.
The regression analysis for visual energy 5:
Visual energy 5 uses regression analysis to provide a mathematical model that shows the correlation between energy consumption and selected influencing factors. This analysis allows you to see whether there is a dependency between energy consumption and any other variable, such as production volume.
If there is a clear relevant correlation, the selected influencing factor should be taken into account when analyzing energy consumption. Here, regression analysis is suitable for comparing the energy consumption actually measured in a defined period with the expected, i.e. previously calculated, value. The difference shows whether there is a saving or an increase in consumption, so that the effectiveness of optimization measures can be continuously checked.
How do I create a regression analysis in visual energy 5?
In the Evaluations area, select a suitable storage folder and then click on the ![]() the menu item Diagrams and then the sub-item Regression analysis.
the menu item Diagrams and then the sub-item Regression analysis.

A window will now open in which you can select the folder folder in which your regression analysis is to be saved and the title of this folder. Confirm your entries by clicking on Add.
A “tile” will now appear in your selected folder, which must now be filled with information. In this tile, click on the button ![]() and another window, your “diagram window”, will open. You now need to fill this with data in order to obtain your regression analysis.
and another window, your “diagram window”, will open. You now need to fill this with data in order to obtain your regression analysis.

Here you select the button ![]() and add a channel add a channel. The following window will then open:
and add a channel add a channel. The following window will then open:

Here you can select the data to be displayed under Select metering point OBIS above, for example, the energy consumption and the production quantity, so that you can recognize the dependencies between the two influencing factors. You can also set how your regression analysis should be displayed, two of the many options include linear or logarithmic. After you have clicked on Add to confirm your entries, your regression analysis will appear as a diagram.
At ![]() , you can manage your channels or selected data quickly and easily. You can also select the time range for which your data should be displayed, for example.
, you can manage your channels or selected data quickly and easily. You can also select the time range for which your data should be displayed, for example.

Your visual energy Team