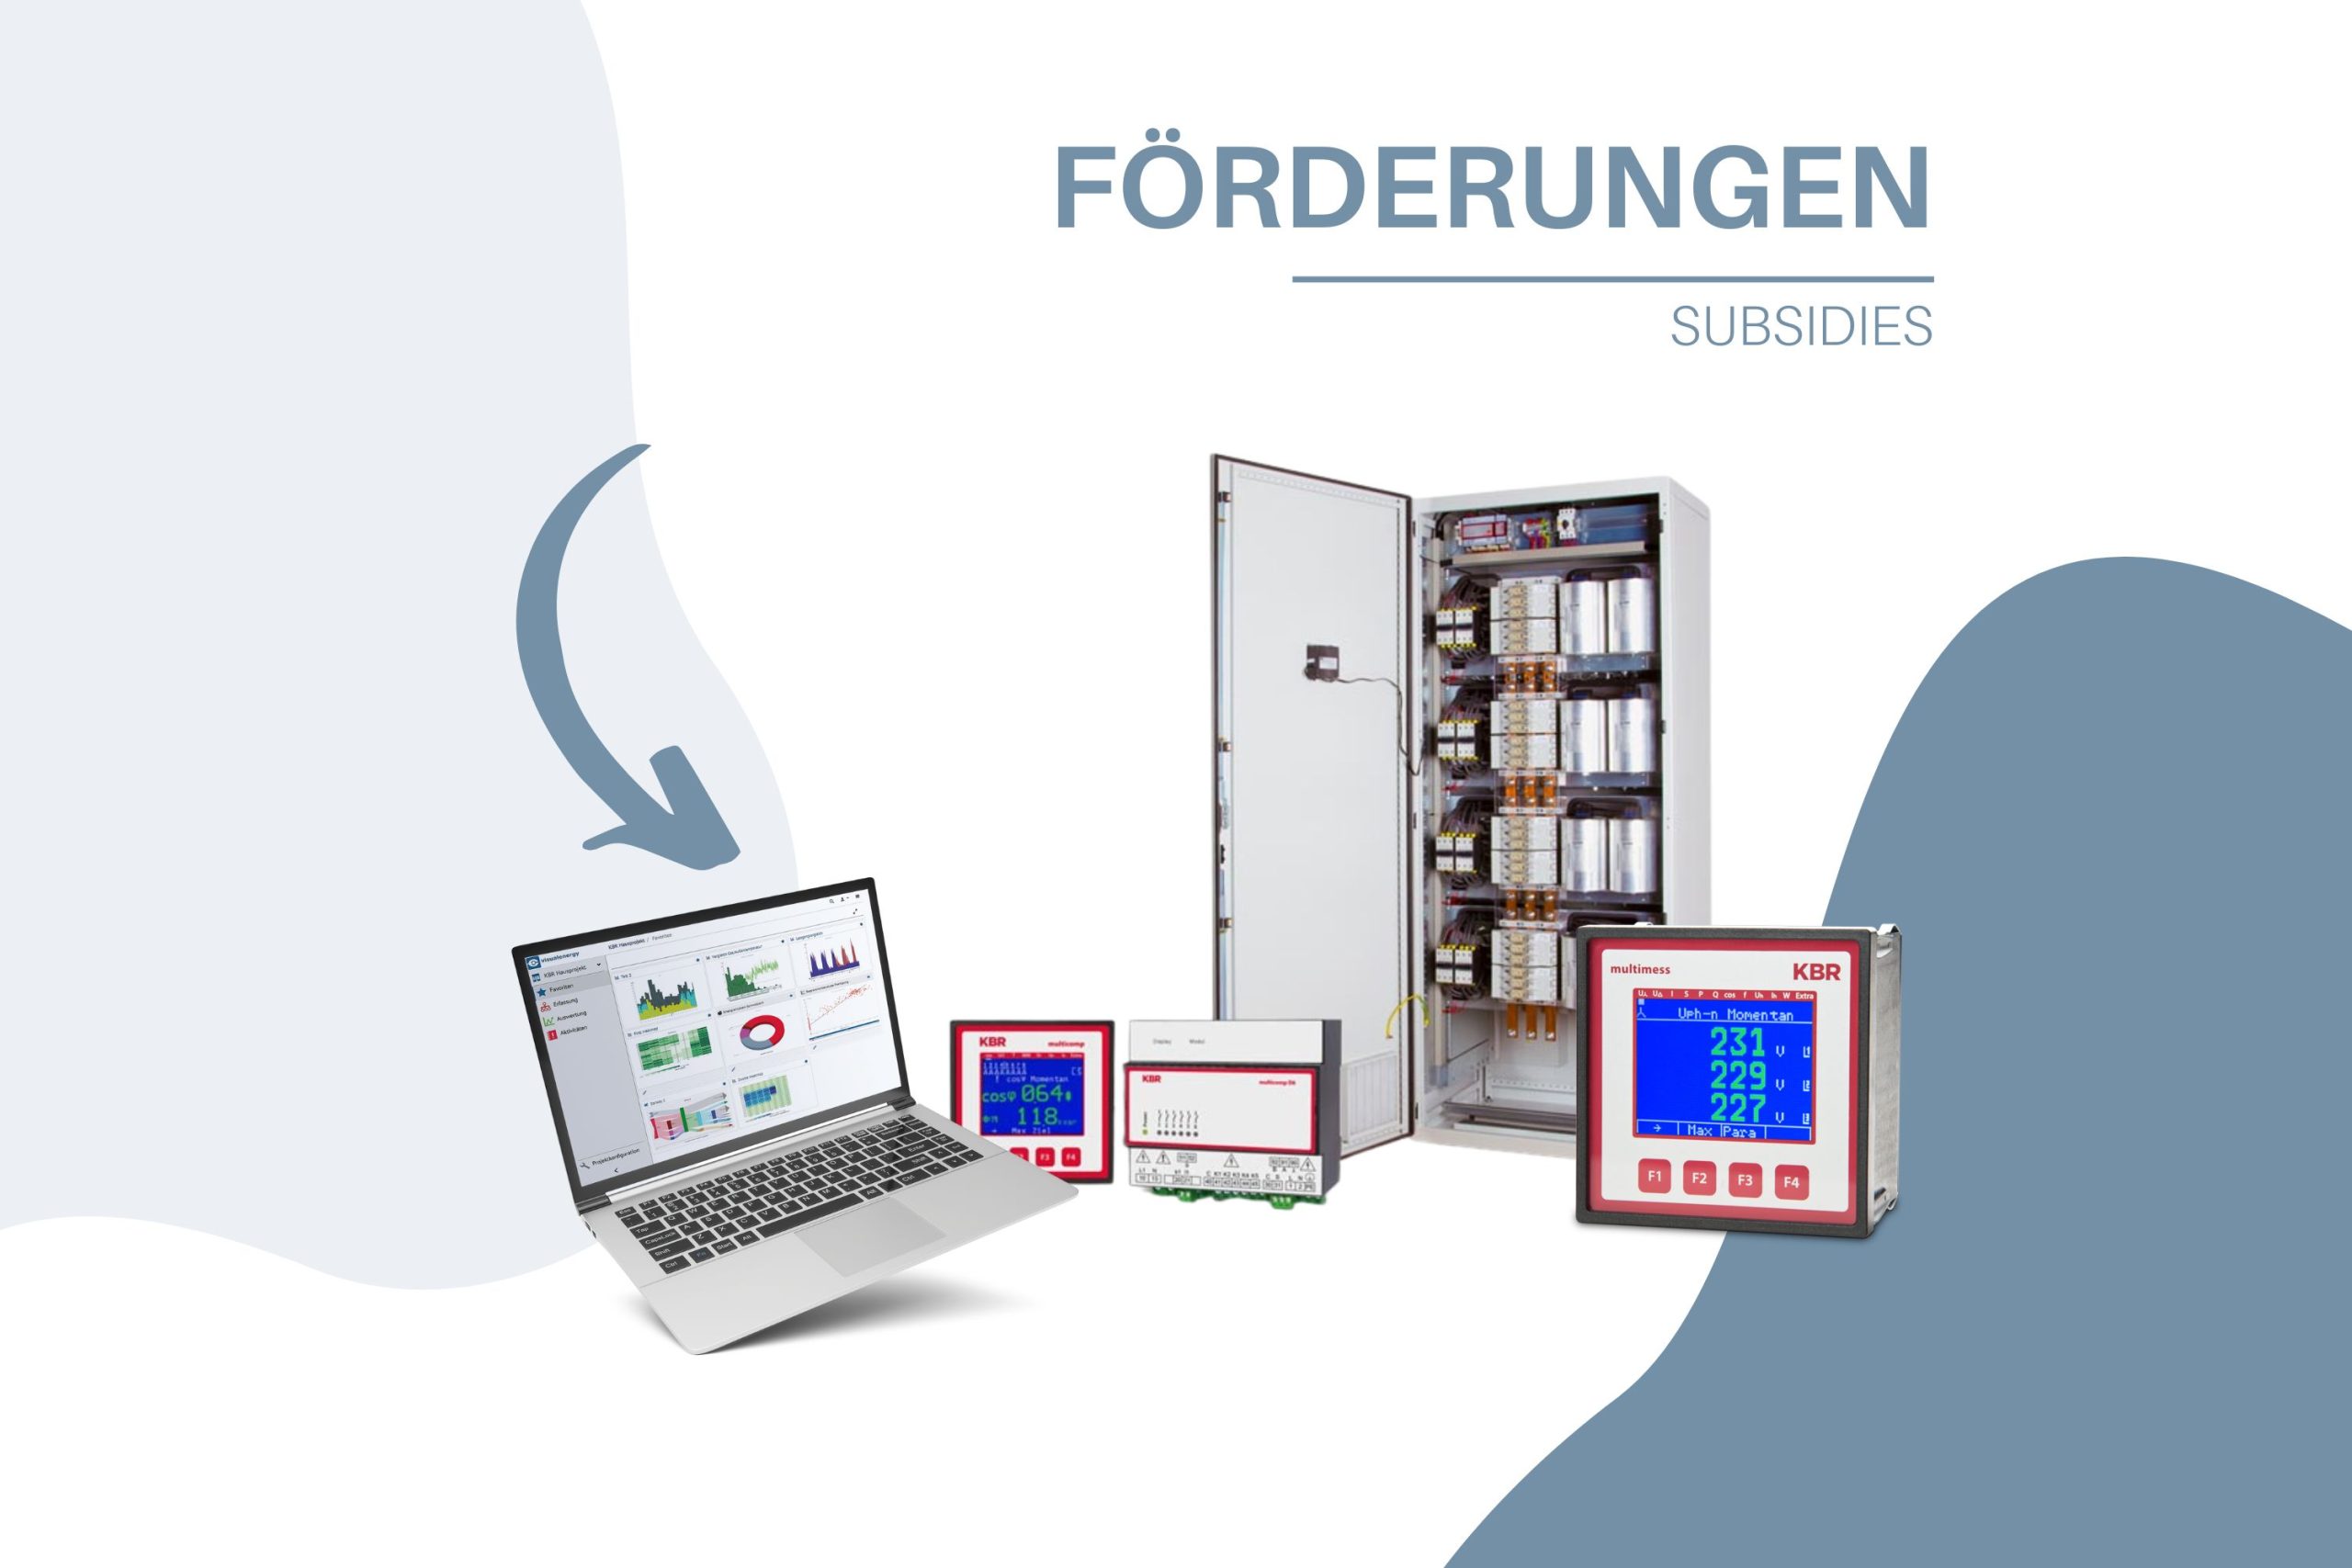
Increase your energy efficiency and reduce your energy consumption.
visual energy is the toolbox for operational energy management. Thanks to its wide range of tools, the software supports energy managers in all their tasks and enables them to analyze and monitor the energy consumption efficiently in every respect: Get to know your powerful tools:
Regression analysis
Visual energy 5 uses regression analysis to provide a mathematical model that shows the correlation between energy consumption and selected influencing factors. This analysis allows you to see whether there is a dependency between energy consumption and any other variable, such as production volume.
Customizable, meaningful key figures – ideal for your energy audit. Use your energy data to draw up meaningful key figures and see whether your energy efficiency targets have been achieved by comparing energy performance indicators before and after.
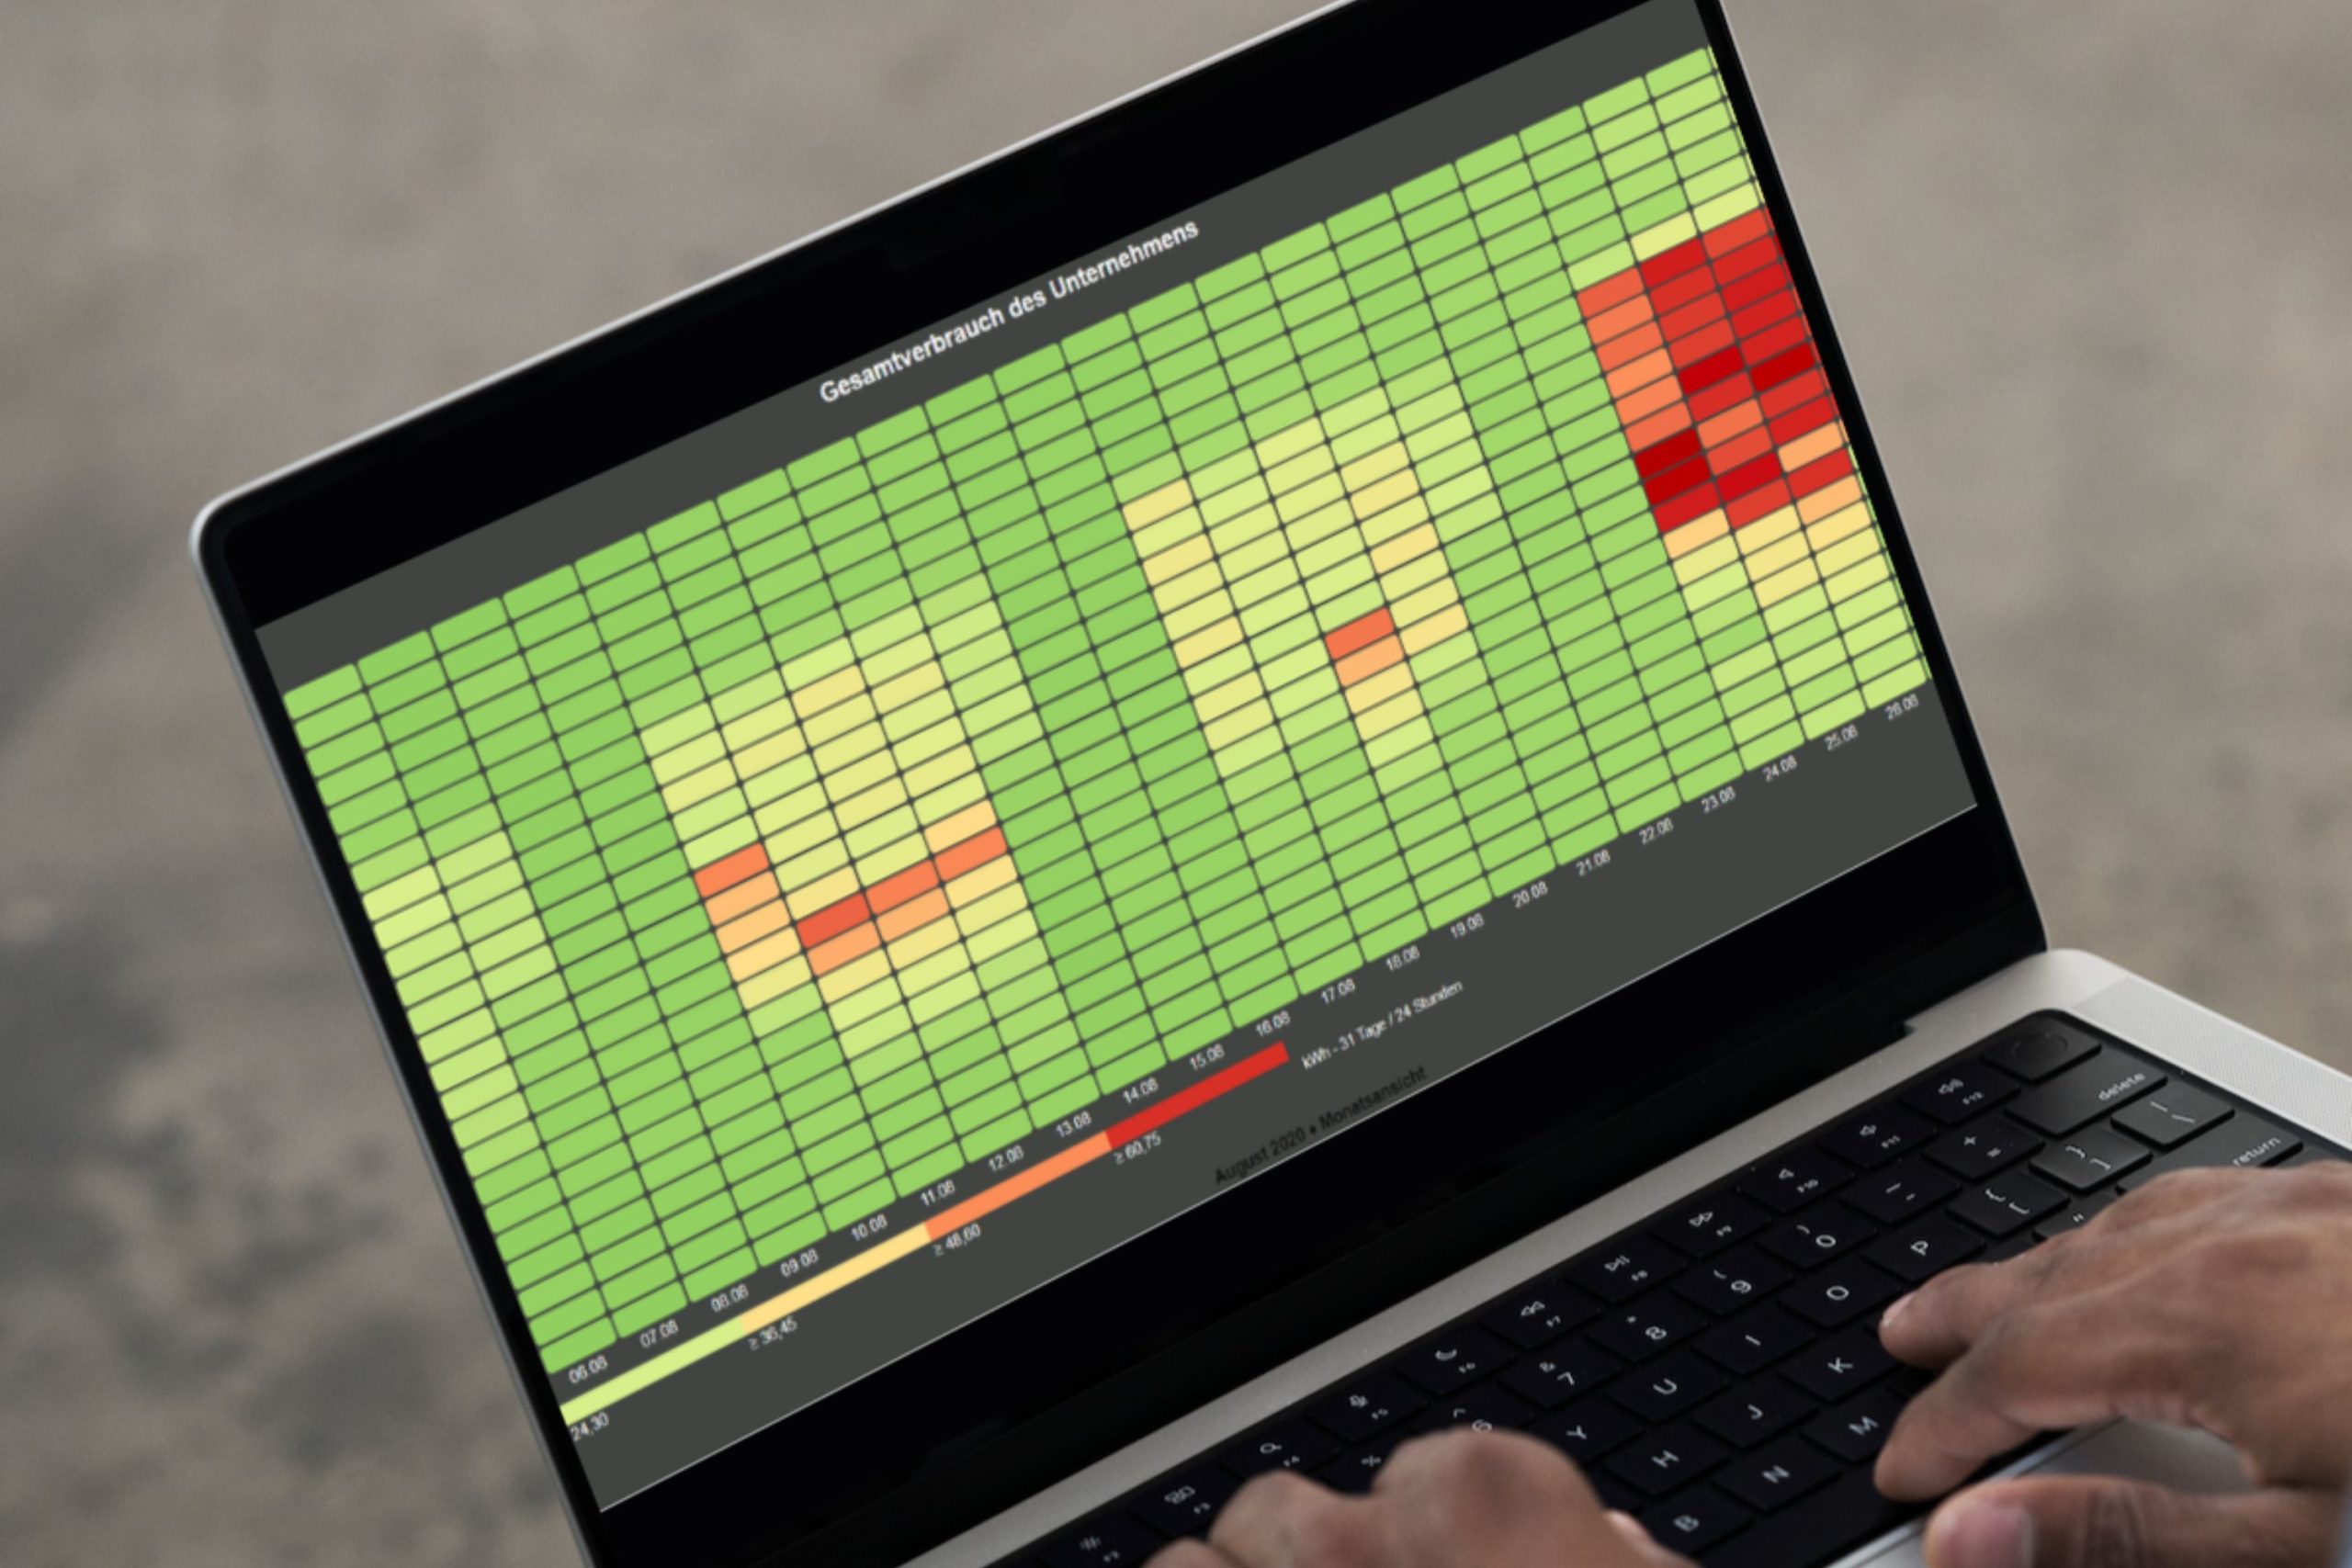
Identify hotspots at a glance by visualizing large amounts of data. Particularly conspicuous values are highlighted in color so that weak points and the need for optimization can be quickly identified. Of course, you also have the option of individually defining all chart properties, such as color scheme, axis scaling or time range.
Visual energy 5 keeps you up to date with user-defined plain text messages. Authorized users can immediately see where the shoe pinches. Receive an immediate notification if previously defined limit values are exceeded and thus achieve optimum control and continuous safety.
Sankey diagram
Freely configurable display of energy flows by combining existing metering points and measured variables. This enables you to identify inefficiencies and economically viable savings potential at a glance. You can process and export these quickly, because all it takes is a click of the mouse and the finished Sankey diagram is available to you as a PDF.
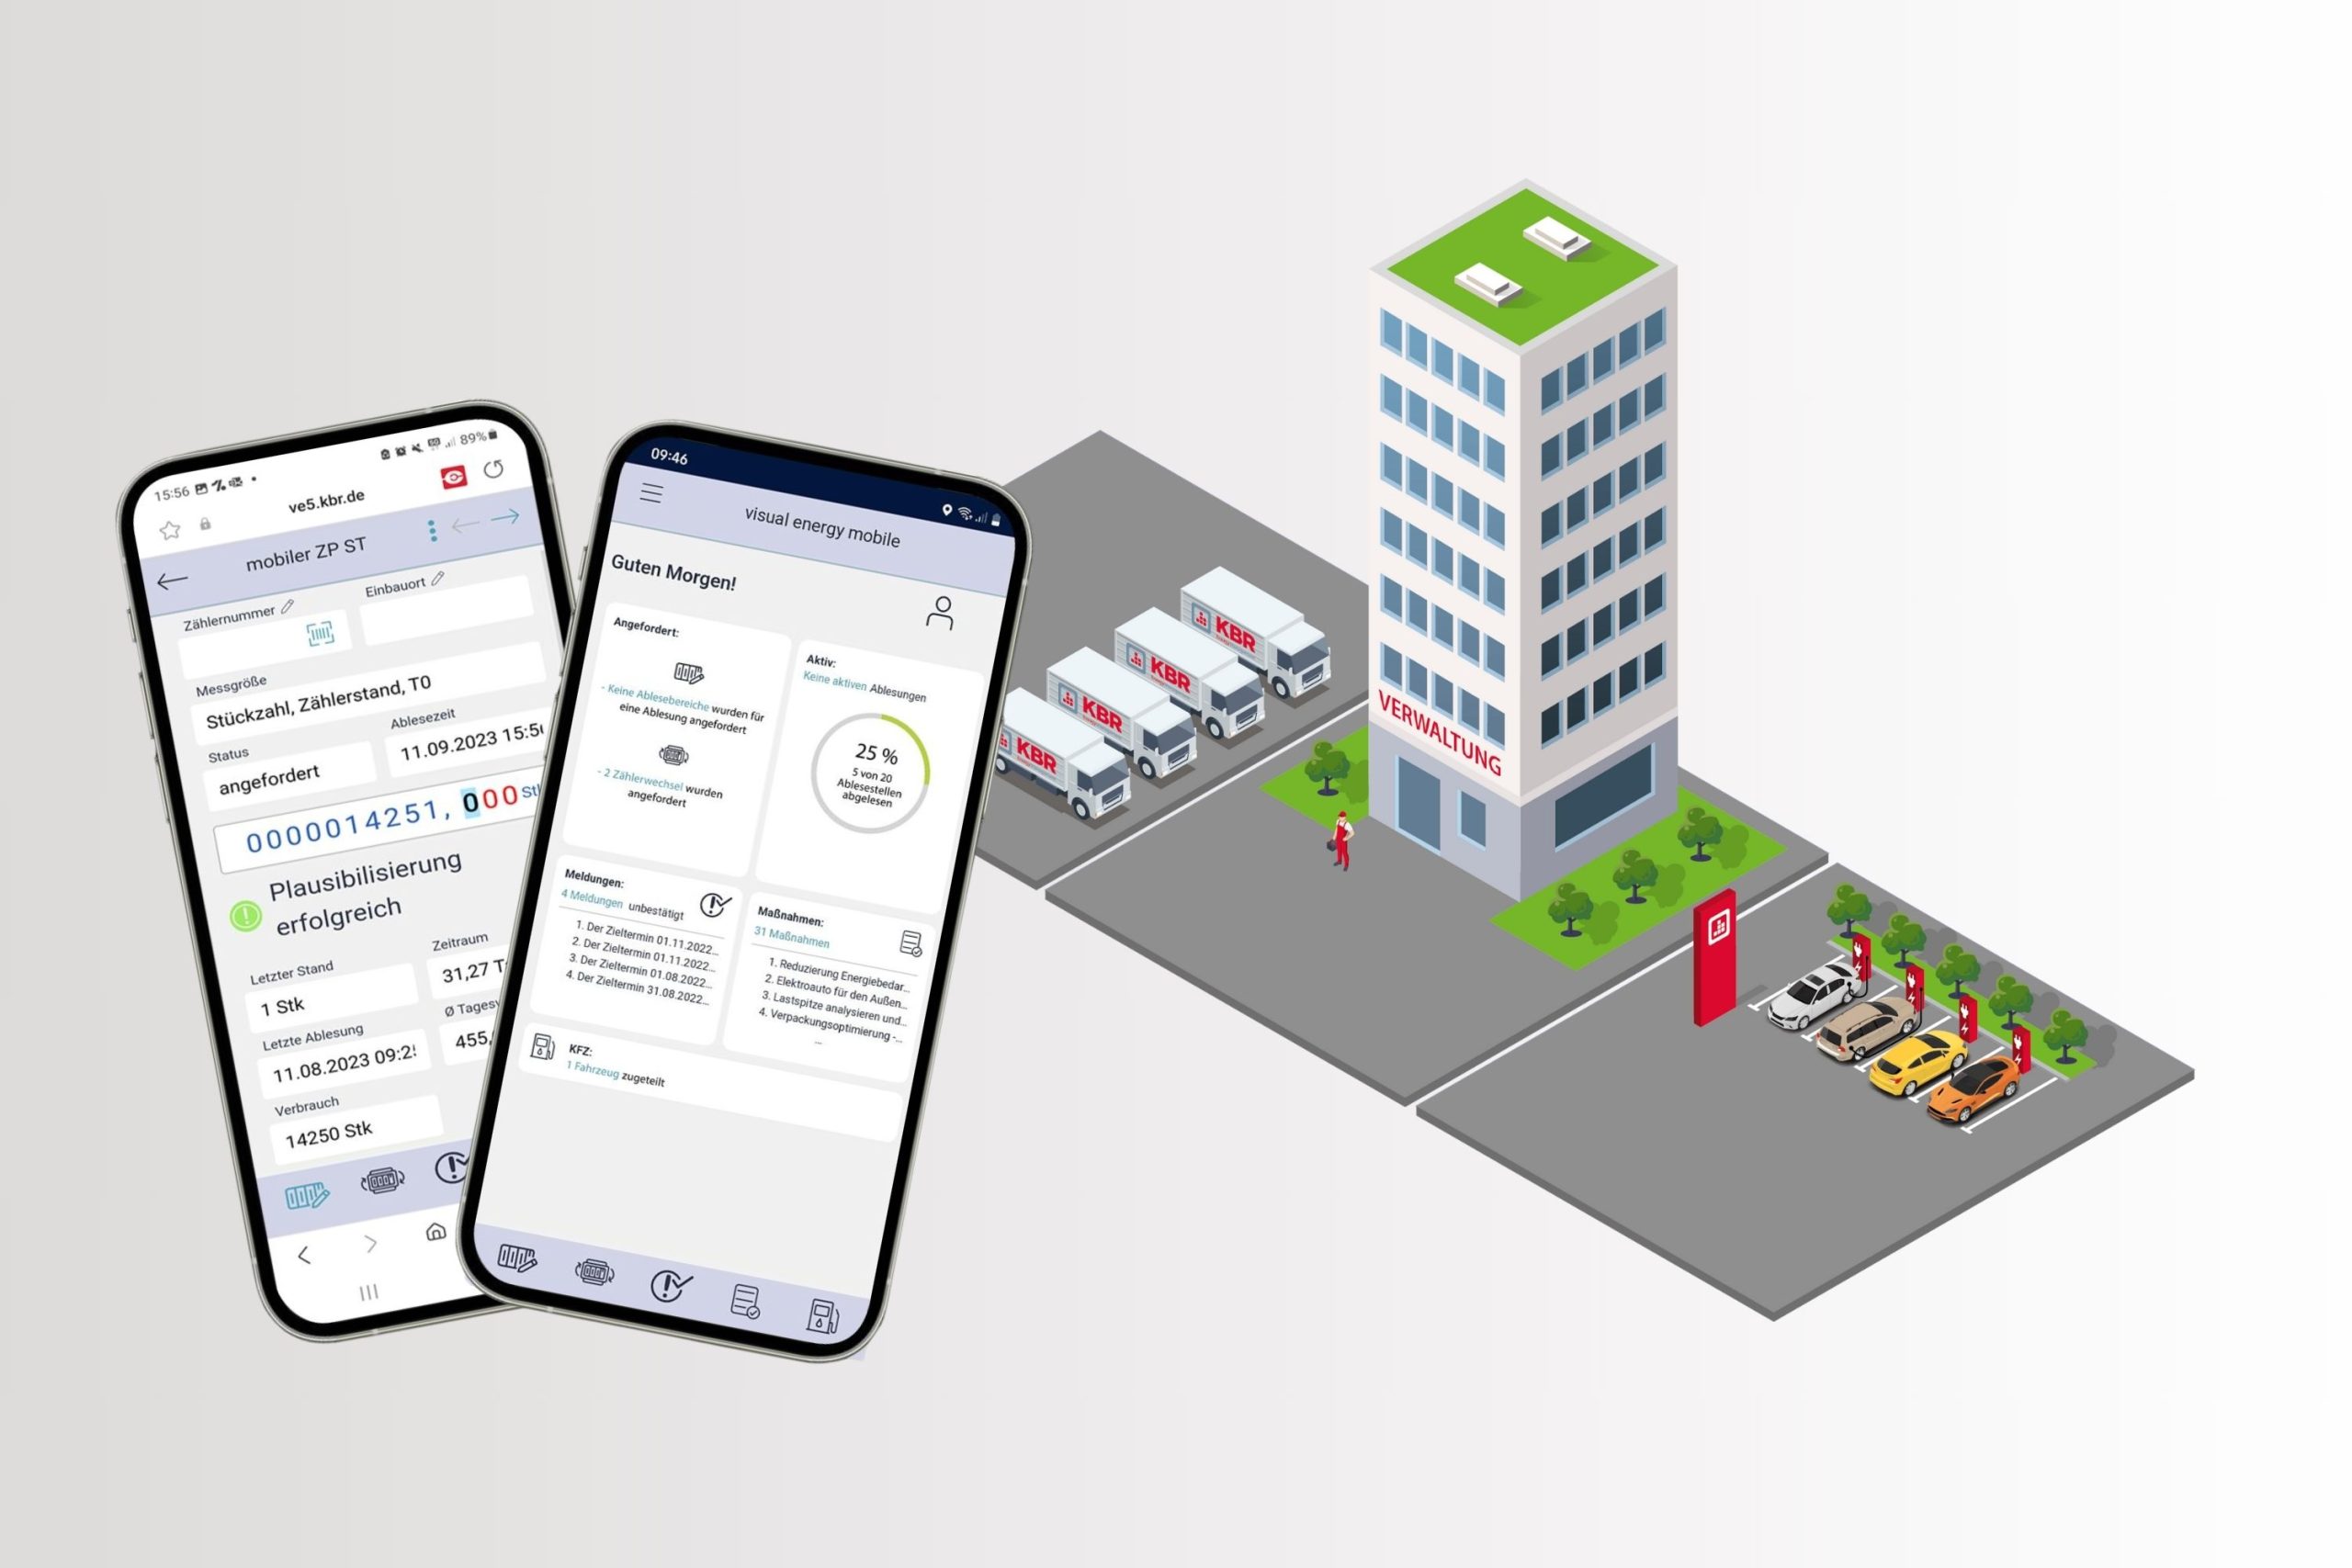
With visual energy 5, you not only increase your energy efficiency, but now also reduce your own time and workload. By simplifying the organization, implementation and documentation of individual measures, the software offers you perfect support in creating a comprehensive action plan.
With visual energy 5, you benefit from an intelligent monitoring system that automatically detects and reports atypical and conspicuous data values on non-working days.
Questions about our solutions or interested in a free KBR workshop?